U.S. Equities
Global Equities
Investors are facing new risks and a market in transition. From the conflict in Ukraine to high inflation and rising interest rates, the future seems as uncertain as ever. And as central banks reduce stimulus, we are likely to see a shift in market leadership, along with sustained volatility.
In these uncertain times, we believe it’s important to step back and consider the long-term trends that are driving companies and markets. That’s why we asked our investment team to highlight 10 themes they are closely following today.
Some of these are within industries under pressure or facing near-term headwinds. But we invest in companies, not industries. It’s our job to analyze individual businesses, meet with management and invest in a select group of companies we believe are most likely to prosper in the years ahead.
Here are 10 investment themes for 2022:
1. Pricing power
2. Tech trifecta
3. Dividend comeback
4. Health care innovation
5. Transportation transformation
6. China challenges and opportunities
7. Media disruption
8. Future of financials
9. ESG everywhere
10. Flexible fixed income
1. Pricing power
Diana Wagner, equity portfolio manager
I believe inflation will linger in the months ahead, making it one of the biggest risk investors face in 2022. That’s why I am focused on uncovering companies with pricing power that can protect their profit margins by passing those costs along to customers.
Companies with pricing power potential include consumer businesses with strong brand recognition, like beverage makers Keurig Dr Pepper and Coca-Cola; companies in the fast-growing video games segment, like Microsoft and Tencent; and companies providing essential services, like Pfizer and UnitedHealth.
Semiconductor companies with proprietary chip designs, like Broadcom, or Dutch chip-equipment maker ASML, could also raise their prices in an inflationary environment.
Some industries have a greater potential for pricing power
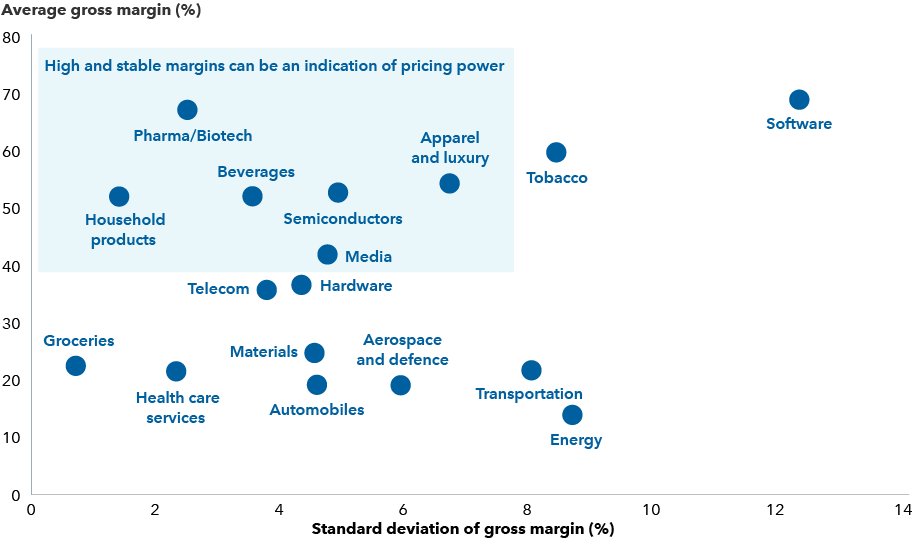
Sources: Capital Group, FactSet, MSCI. Reflects select industries within the MSCI World Index. Average and standard deviation of gross margins are calculated for the five-year period ending 12/31/21. Average gross margin is net sales less the cost of goods sold and is shown as a percentage of net sales. Standard deviation is a common measure of variation that tells how a statistic has varied from the mean over time. A lower number signifies lower volatility.
With slowing growth, rising inflation and conflicts overseas, 2022 is off to a rough start. But I’m optimistic that an active portfolio of select companies with strong pricing power may help investors thrive in the year ahead.
Go deeper:
- Pricing power can help companies fight inflation
- 5 keys to investing in 2022
2. Tech trifecta
Mark Casey, equity portfolio manager
Semiconductors, cloud computing and software — what I call the tech trifecta — are three industries I’m following closely this year.
If pricing power is a key to fighting inflation, then the semiconductor industry is in a strong position. Supply chain disruptions have chip prices skyrocketing, pressuring manufacturers that increasingly depend on them. Anyone who tried to find a PlayStation 5 last Christmas knows what I mean.
Even in the wake of supply chain issues, I see no end to the world’s appetite for semiconductors. Today a new car uses as many as 3,000 chips, and that number is growing with each new model.
Semiconductors are the backbone cloud technology companies use to power their business. I believe we are still in the early innings of the cloud transition. For example, makers of CPUs, like Advanced Micro Devices; DRAM chipmaker Samsung; and ST Microelectronics, which develops microcontrollers, could all see demand multiply for years.
Demand for semiconductors is soaring, along with prices
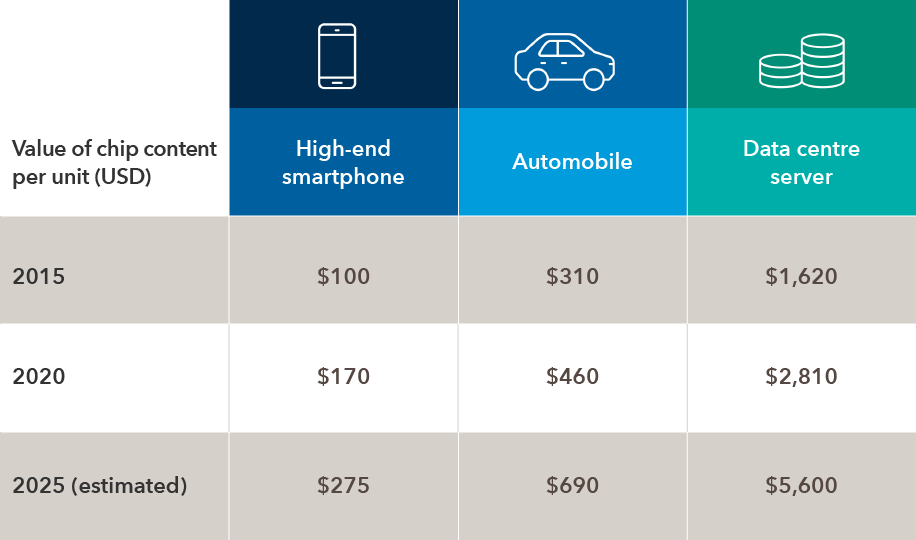
Sources: Capital Group, Applied Materials. All figures are in USD. As of June 16, 2021.
If chips are the backbone of the cloud, then software is the brains. Today, software is driving advancements not only in e-commerce and finance but also health care, education, transportation, construction and agriculture. It’s been a tough year in the market for many software-as-a-service (SaaS) companies. But my job is to look past today’s volatility to understand fundamental growth dynamics that can drive long-term returns.
Go deeper:
- Storm cloud: Look past turbulence in software stocks
- Semiconductors could be the new oil: Here’s why
- 5 technology trends to watch
3. Dividend comeback
Caroline Randall, equity portfolio manager for Capital Group Capital Income BuilderTM (Canada)
Companies are shifting from dividend zeros to dividend heroes.
Particularly in Europe, companies suspended dividends during the pandemic primarily due to political or regulatory pressure, but now many of them have surplus capital to redeploy as regular and catch-up dividends.
You might think the search for dividend income starts with companies that pay the highest yields. While these companies can be sound investments, a high dividend yield can also be a warning sign and potentially unsustainable.
Our research shows that since 2007, the highest yielding quintile of stocks had the lowest overall returns. We found the sweet spot to be the next bucket of dividend payers, those that yielded closer to 3%. This group included companies with more stable balance sheets and attractive dividend growth prospects.
Businesses across sectors and borders are raising their dividends
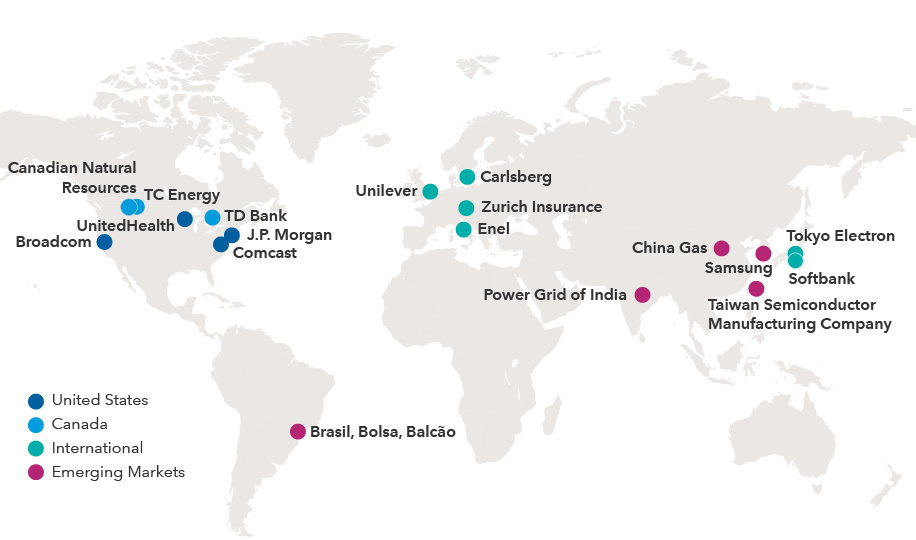
Sources: Capital Group, Refinitiv Datastream. Represents examples of companies that have raised their dividends during the two-year period from 12/31/19 - 12/31/21.
This year, I’m focused on companies with strong underlying earnings growth that have demonstrated a commitment to raising their dividends over time. Increasing dividend payouts can be a signal of management’s confidence in future earnings growth. Dividend growers historically have tended to generate greater returns than other dividend strategies, while also keeping up with the broader market. Dividend growth can also offer a measure of resilience against inflation and interest rate hikes.
Go deeper:
- Dividend growth: The secret sauce of long-term investing
4. Health care innovation
Rich Wolf, equity portfolio manager
Life-changing drugs are being developed and approved faster than ever. The COVID-19 mRNA vaccines from Pfizer and Moderna provide a powerful affirmation of the global nature of innovation.
Will that breakneck speed continue in 2022? With recent advancements in genomic and proteomic analysis and the launch of many new modalities of drugs, I believe it will. Today we have new therapies designed to engineer how the body recognizes and treats disease itself that have the potential to extend lives and generate billions of dollars in revenue for companies able to develop them successfully.
New drugs are coming to market faster than ever
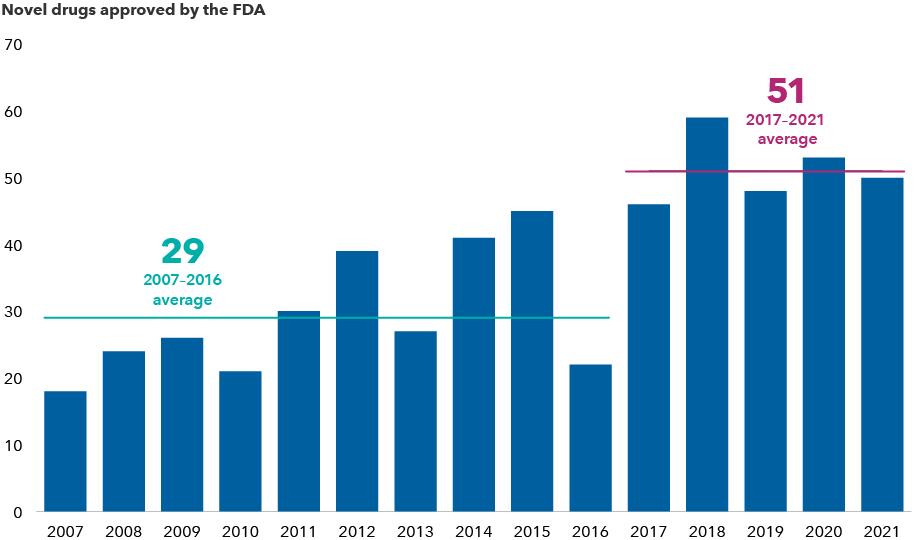
Source: U.S. Food and Drug Administration. As of 12/31/21.
But it’s not just drug discovery that excites me. A massive wave of innovation from health technology companies has led to improved diagnostics — both in the lab and at home. For example, Dexcom’s continuous glucose monitors allow diabetics to continuously check their glucose levels and integrate that information directly to an insulin pump.
Companies like Exact Sciences and Illumina have developed liquid biopsy blood tests and genomic technologies that enable early detection of cancer and help in the research of complex diseases. In addition, as the technology improves, remote patient monitoring and home diagnostics are becoming part of the continuum of care.
Go deeper:
- Medical miracle: Health care innovation saves the world
- Health care innovation reaches warp speed
5. Transportation transformation
Kaitlyn Murphy, equity investment analyst covering automobile & components manufacturers
Ladies and gentlemen, start your batteries.
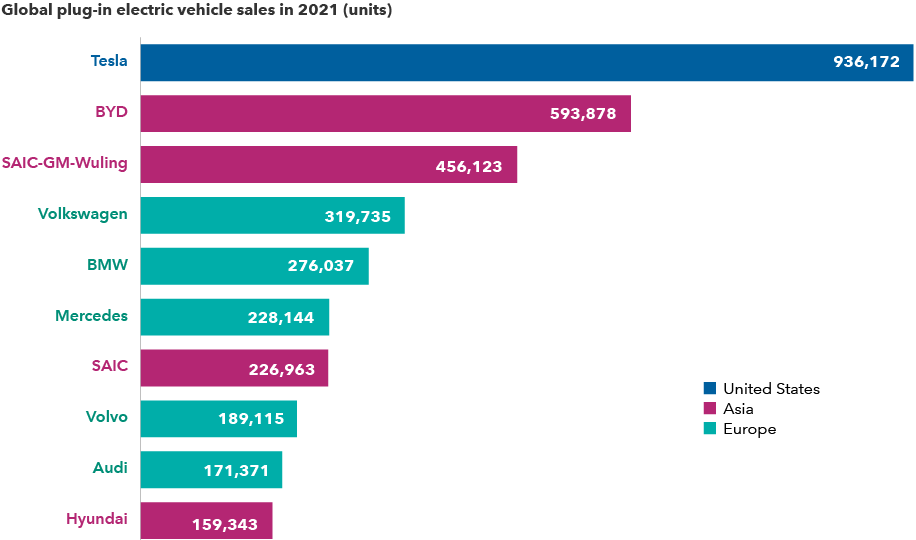
The adoption curve of electric vehicles (EVs) has steepened thanks in large part to government incentives and tighter emissions standards for gas-burning cars, particularly in China and Europe. The price of batteries, which can account for a third of a vehicle’s cost, has also plunged. EV makers are now appealing to more consumers by introducing models with lower prices, better performance and longer range.
Tesla has raced ahead of global competition in EV sales
Sources: CleanTechnica, EV-Volumes.com, Statista. Estimates as of January 2022. SAIC-GM-Wuling is a joint venture based in China.
Although EVs are on the threshold of profitability, some will likely get there sooner than others. Tesla has been a clear leader, having briefly surpassed a market cap of US$1 trillion in 2021. Companies quick to embrace structural change and rapidly adapt have a better chance of success over the long term, whether they are industry titans or startups. Innovative manufacturers can also differentiate themselves with their use of software, which allows for vehicles that can learn and improve, become safer and introduce more services over time.
Many believe the level of disruption in transportation will make it difficult for incumbents to survive, but don’t count them out. At General Motors, CEO Mary Bara is disrupting the company from within. In addition to its pledge to go all-electric by 2035, the company has invested heavily in Cruise, its self-driving unit. I believe it could be one of the future leaders.
Go deeper:
- Beyond Tesla: Electric cars shift into the fast lane
- These 3 laws drive innovation and investment opportunity
6. China challenges and opportunities
Winnie Kwan, equity portfolio manager for Capital Group Capital Income BuilderTM (Canada)
Risks to investing in China have risen due to macro and regulatory issues. Investors need to tread carefully with sectors such as property, education and gaming. However, I believe there are still compelling long-term, secular growth trends that make the country an attractive market on a stock-by-stock basis.
For example, China is positioned to dominate the global manufacturing supply chain for EVs and decarbonization solutions such as solar. Chinese manufacturers are producing high value-add parts at scale, including servo motors, electric drive trains and thermo management systems. A fast-growing home market for EVs is supportive of the supply chain development. China is already a dominating force in solar panel manufacturing, and it is increasingly leading in specific components such as inverters.
Automation is another growth area, driven by manufacturing upgrades and an aging population. Japanese and European companies have historically dominated production of precision parts and components in automation, but Chinese manufacturers are rapidly taking share.
Localization and import substitution continue to be big trends, not only in capital goods but in health care and medical technology equipment. At the same time, contract development and manufacturing organizations have become a sweet spot. These companies are partnering with multinationals on drug development, testing and manufacturing, often at lower prices and higher efficiency.
Go deeper:
- What I learned on a trip through China
- What does heightened China risk mean for investors?
- China's economy risks a sharp slowdown in growth
7. Media disruption
Martin Romo, equity portfolio manager for Capital Group U.S. Equity FundTM (Canada)
This January, three blockbuster deals announced over a matter of days highlighted the swift change of pace in the industry.
If all three are finalized — Microsoft’s bid for gaming giant Activision Blizzard among them — it would amount to more than US$90 billion in M&A activity centered on video games, the fastest growing segment of the media sector.
Driven in part by a pandemic-era gaming boom, the media landscape is fundamentally transforming the way people interact and entertain themselves. That makes interactive games all the more valuable to the likes of Microsoft, Sony and many others.
It’s a testament to how powerful and alluring video games have become. The US$200 billion gaming industry provides compelling entertainment at a reasonable cost, and it’s already surpassed the movie industry in terms of annual gross revenue. Fundamentally, I think that growth is likely to continue and even accelerate in the years ahead.
The disruption also extends to other segments of the media and entertainment world. Netflix, the clear leader in streaming video with over 200 million subscribers worldwide, is encountering fierce competition from Amazon and Apple, as well as old guard companies like Disney. The biggest threat to Netflix’s dominance may be Disney+, whose deep library of intellectual property-driven content has helped it attract 130 million subscribers in just three years.
Go deeper:
- 5 predictions for the future of media
8. Future of financials
Emme Kozloff, equity investment analyst covering global capital market infrastructure providers and U.S. and European discount brokers
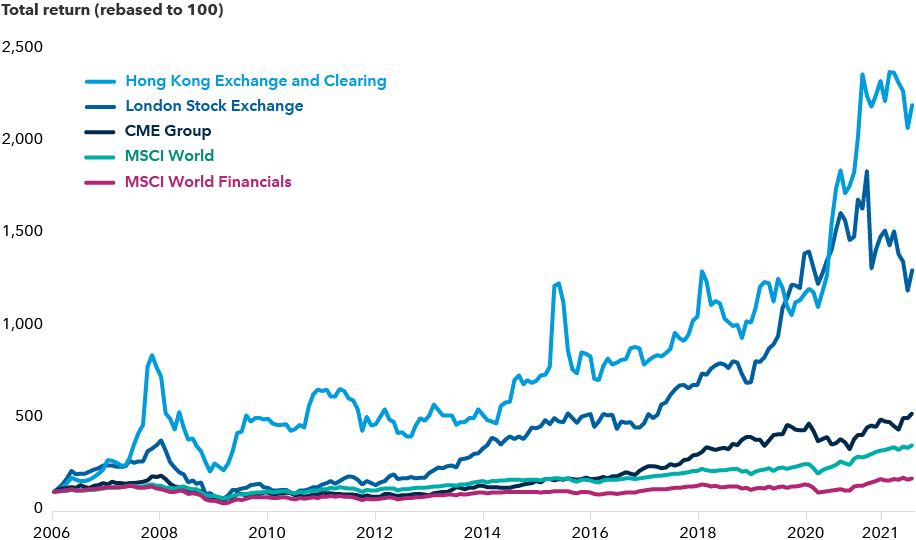
Today the financials sector encompasses a broader set of opportunities than traditional banks and insurers. Among these are exchanges, data providers and asset managers. Financial exchanges that focus on equity trading may even benefit from increased volume during volatile markets.
Financial exchanges have outpaced the broader market
Sources: MSCI, RIMES. Returns rebased to 100 on 12/31/05. As of 12/31/21. Returns are in USD.
I believe several trends will drive growth in financial exchanges. One is the modernization of fixed income trading, which is moving out of the horse-and-buggy era. As fixed income — by far the largest asset class in the world with over US$100 trillion in assets — moves to digital trading, exchanges like Tradeweb could see their sales volumes soar.
Another driver of growth is the voracious appetite for data analytics. London Stock Exchange, known primarily for its equity exchanges, and Standard & Poor’s, known largely as a ratings agency and index creator, have built robust analytics offerings. Likewise, only a third of NASDAQ’s revenue comes from trading with much of the rest coming from its data services segment. I don’t think the market fully appreciates just how diversified many of these companies are.
To invest successfully in financials, it can help to look really closely at each of these companies to understand what assets they own and where those offerings fit into the business cycle.
Go deeper:
- In the money: Financial exchanges hit the sweet spot
9. ESG everywhere
Rob Lovelace, vice chair and president of Capital Group and portfolio manager for Capital Group Canadian Focused Equity FundTM (Canada)
Environmental, social and governance investing, or ESG, is everywhere, and it's only going to get more important.
At Capital Group, we have fully integrated ESG principles into our investment process, and it’s a part of every investment decision we make. We don’t think of ESG as just an exclusion process. We think of it as identifying companies that are doing the right thing and supporting those in transition, such as oil companies shifting toward clean energy.
This effort extends far beyond the energy sector. For example, buildings pump more carbon dioxide into the atmosphere than the entire transport industry. One of the most effective ways to reduce greenhouse gas emissions is to improve air conditioning and heating efficiency. Regulations that require the replacement of older systems with more energy-efficient products in Europe and elsewhere could underpin a long-term tailwind for HVAC companies like Daikin and Carrier.
I understand there is some trepidation about how our industry will implement ESG concepts. People are worried about new government regulations, additional rules or expanded disclosure requirements. But I would say: This is important. While there’ a lot to learn, I believe we should approach it with a sense of optimism and enthusiasm.
Go deeper:
- The future of ESG investing depends on deep analysis
- Rob Lovelace on the year ahead
10. Flexible fixed income
Damien McCann, fixed income portfolio manager
Inflation is running hot — and that’s cooling bond returns. Speculation about the U.S. Federal Reserve’s path and pace of interest rate hikes has pressured bond prices.
The good news? High inflation is partially a response to extraordinary consumer demand. The economy is doing well. People have jobs and cash — and they want to spend it. What’s more, many companies have strong balance sheets and are positioned for growth.
In my mind, this means there are solid investment opportunities in corporate bonds. The post-pandemic economy may benefit casinos and cruise lines as demand returns. Energy prices have jumped, which could help both midstream and exploration and production companies. On the other hand, I think that rising labour costs and shortages could crimp growth for consumer-oriented retail companies. Restaurants may also feel the pinch.
The relative value between higher income bond sectors such as investment grade(rated BBB/Baa and above), high yield, emerging markets and securitized debt is always changing. I’m focused on identifying which of these offer the most attractive investment opportunities for income-seeking investors. Recently, the underlying strength in the economy and the shorter interest duration in high yield and securitized debt have made those sectors more attractive.
I take a flexible, diversified approach to allocating among these different sectors based on market conditions and investment insights. This could help create a more resilient income and return stream for investors.
Go deeper:
- 2022 fixed income outlook
- The long unwinding road: Our take on Fed tapering and inflation
Keeping 2022 volatility in perspective
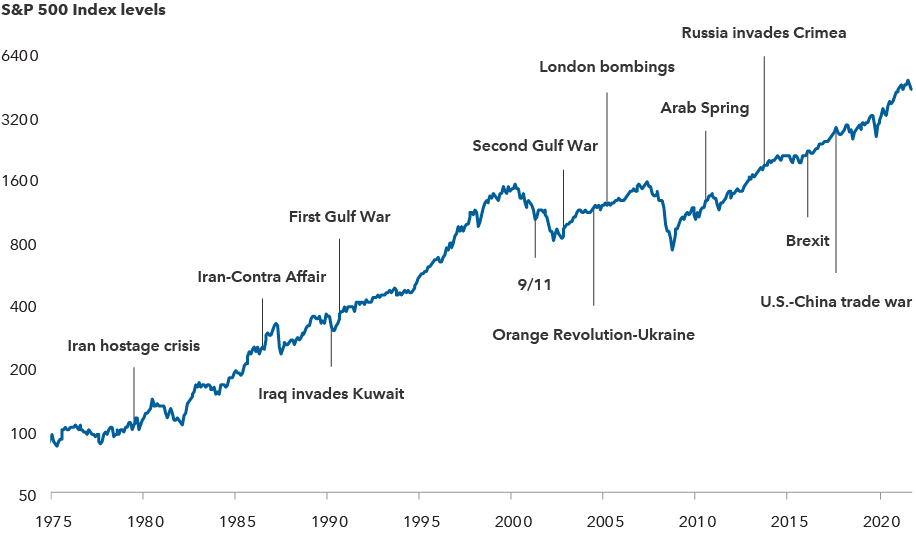
Today’s challenging environment is causing more market volatility than we’ve seen since the onset of the pandemic. Against a backdrop of slowing growth and high inflation, the tragic war in Ukraine adds a new series of risks and unknowns.
However, history has shown that markets have powered through past periods of geopolitical market shocks. It’s important to remember that investors can still find opportunity in the midst of chaos — be it war, inflation, or recession. There are still many companies that are thriving and innovating, so that’s where we focus most of our time and energy.
Equity markets have historically powered through geopolitical events
Sources: Capital Group, Refinitiv Datastream, Standard & Poor’s. Index levels reflect price returns in USD, and do not include the impact of dividends. Chart shown on logarithmic scale. As of 2/28/22. Standard & Poor’s 500 Composite Index is a market capitalization-weighted index based on the results of approximately 500 widely held common stocks.
Our primary message for investors is to stay committed to your long-term investment goals. Don’t be disoriented by moments of crisis. Remember that markets over the long term have been resilient and have powered through many challenges. Now is the time to evaluate your portfolio, stay focused on your path and try not to let external events derail your objectives.
CME Group is the world's largest financial derivatives exchange.
MSCI World Index is a free float-adjusted market capitalization-weighted index designed to measure equity market results of developed markets. The index consists of more than 20 developed market country indices, including the United States. MSCI World Financials is a subcomponent of the MSCI World Index and only contains companies within the financial sector.
Our latest insights
10 investment themes for 2022
RELATED INSIGHTS
-
-
U.S. Equities
-
Long-Term Investing
Commissions, trailing commissions, management fees and expenses all may be associated with investments in investment funds. Please read the prospectus before investing. Investment funds are not guaranteed or covered by the Canada Deposit Insurance Corporation or by any other government deposit insurer. For investment funds other than money market funds, their values change frequently. For money market funds, there can be no assurances that the fund will be able to maintain its net asset value per security at a constant amount or that the full amount of your investment in the fund will be returned to you. Past performance may not be repeated.
Unless otherwise indicated, the investment professionals featured do not manage Capital Group‘s Canadian investment funds.
References to particular companies or securities, if any, are included for informational or illustrative purposes only and should not be considered as an endorsement by Capital Group. Views expressed regarding a particular company, security, industry or market sector should not be considered an indication of trading intent of any investment funds or current holdings of any investment funds. These views should not be considered as investment advice nor should they be considered a recommendation to buy or sell.
Statements attributed to an individual represent the opinions of that individual as of the date published and do not necessarily reflect the opinions of Capital Group or its affiliates. This information is intended to highlight issues and not be comprehensive or to provide advice. For informational purposes only; not intended to provide tax, legal or financial advice. Capital Group funds are available in Canada through registered dealers. For more information, please consult your financial and tax advisors for your individual situation.
Forward-looking statements are not guarantees of future performance, and actual events and results could differ materially from those expressed or implied in any forward-looking statements made herein. We encourage you to consider these and other factors carefully before making any investment decisions and we urge you to avoid placing undue reliance on forward-looking statements.
The S&P 500 Composite Index (“Index”) is a product of S&P Dow Jones Indices LLC and/or its affiliates and has been licensed for use by Capital Group. Copyright © 2025 S&P Dow Jones Indices LLC, a division of S&P Global, and/or its affiliates. All rights reserved. Redistribution or reproduction in whole or in part are prohibited without written permission of S&P Dow Jones Indices LLC.
FTSE source: London Stock Exchange Group plc and its group undertakings (collectively, the "LSE Group"). © LSE Group 2025. FTSE Russell is a trading name of certain of the LSE Group companies. "FTSE®" is a trade mark of the relevant LSE Group companies and is used by any other LSE Group company under licence. All rights in the FTSE Russell indices or data vest in the relevant LSE Group company which owns the index or the data. Neither LSE Group nor its licensors accept any liability for any errors or omissions in the indices or data and no party may rely on any indices or data contained in this communication. No further distribution of data from the LSE Group is permitted without the relevant LSE Group company's express written consent. The LSE Group does not promote, sponsor or endorse the content of this communication. The index is unmanaged and cannot be invested in directly.
BLOOMBERG® is a trademark and service mark of Bloomberg Finance L.P. and its affiliates (collectively “Bloomberg”). Bloomberg or Bloomberg’s licensors own all proprietary rights in the Bloomberg Indices. Neither Bloomberg nor Bloomberg’s licensors approves or endorses this material, or guarantees the accuracy or completeness of any information herein, or makes any warranty, express or implied, as to the results to be obtained therefrom and, to the maximum extent allowed by law, neither shall have any liability or responsibility for injury or damages arising in connection therewith.
MSCI does not approve, review or produce reports published on this site, makes no express or implied warranties or representations and is not liable whatsoever for any data represented. You may not redistribute MSCI data or use it as a basis for other indices or investment products.
Capital believes the software and information from FactSet to be reliable. However, Capital cannot be responsible for inaccuracies, incomplete information or updating of the information furnished by FactSet. The information provided in this report is meant to give you an approximate account of the fund/manager's characteristics for the specified date. This information is not indicative of future Capital investment decisions and is not used as part of our investment decision-making process.
Indices are unmanaged and cannot be invested in directly. Returns represent past performance, are not a guarantee of future performance, and are not indicative of any specific investment.
All Capital Group trademarks are owned by The Capital Group Companies, Inc. or an affiliated company in Canada, the U.S. and other countries. All other company names mentioned are the property of their respective companies.
Capital Group funds are offered in Canada by Capital International Asset Management (Canada), Inc., part of Capital Group, a global investment management firm originating in Los Angeles, California in 1931. Capital Group manages equity assets through three investment groups. These groups make investment and proxy voting decisions independently. Fixed income investment professionals provide fixed income research and investment management across the Capital organization; however, for securities with equity characteristics, they act solely on behalf of one of the three equity investment groups.
The Capital Group funds offered on this website are available only to Canadian residents.
 Jody Jonsson
 Martin Romo