Market Volatility
Categories
U.S. Equities
3 views on where to invest under Trump 2.0
 Jared Franz
 Richmond Wolf
 Chitrang Purani
February 19, 2025
One month into President Trump’s second term, investors are spinning from one news cycle to the next. From higher tariffs to massive cost cutting and other sweeping initiatives, Trump’s policy goals come with significant investment implications.
Centre stage are executive orders that will impact companies in a broad range of industries, from aerospace and defence to industrials and banking. Waiting in the wings are year-end expirations of major provisions of the Tax Cuts and Jobs Act and expanded funding under the U.S. Affordable Care Act.
Which sectors could rise or fall under Trump 2.0?
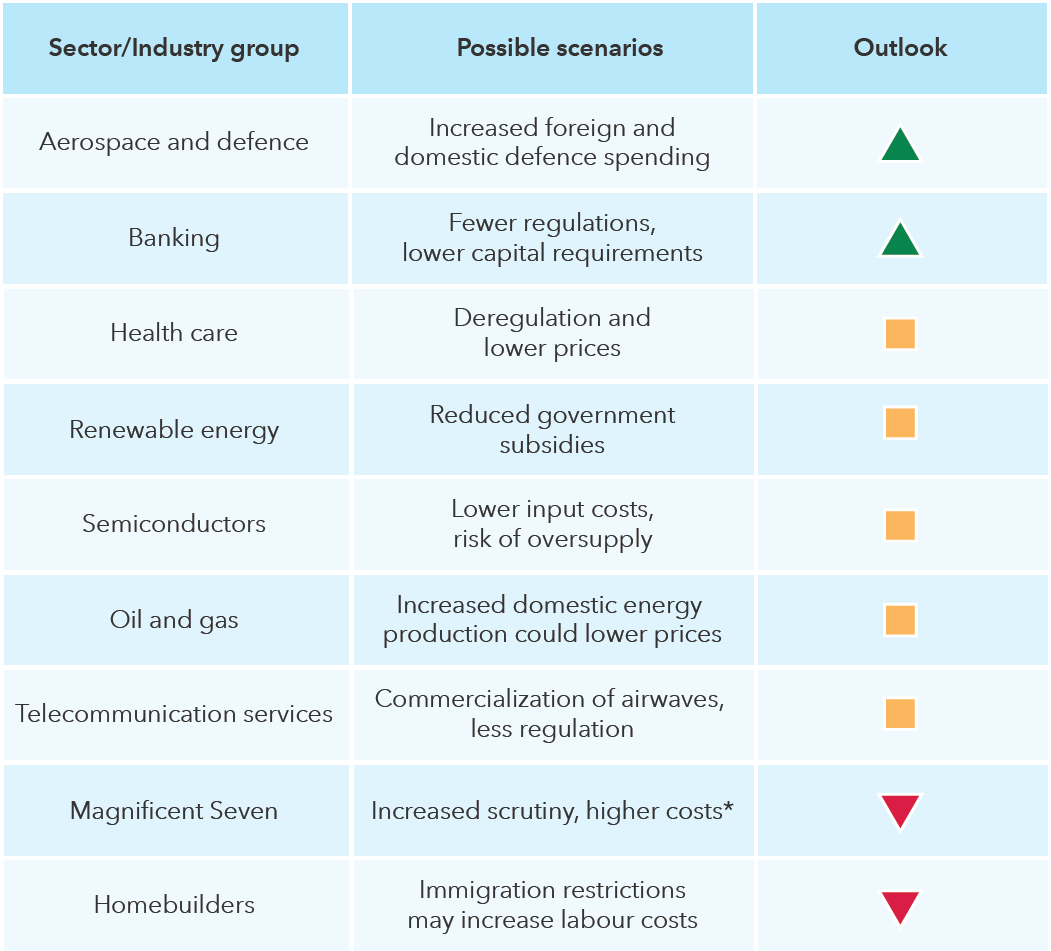
Source: Capital Group. As of November 8, 2024. *Higher costs may occur if certain companies are required to pay into the U.S. Federal Communications Commission’s Universal Service Fund. For illustrative purposes only. Outlooks of individual investment analysts and portfolio managers may differ.
The ultimate winners of Trump 2.0 are likely companies that can successfully navigate policy and technology shifts, and a bottoms-up analysis can help separate the long-term winners. Three Capital Group investment professionals offer their take on opportunities and vulnerabilities as the Trump administration seeks to drastically reshape foreign and domestic policy.
1. America first approach brings manufacturing to the fore
President Trump's term may signal a philosophical pivot from free trade to protectionism. That means tariffs and other trade barriers are likely here to stay.
An “America first” policy aims to increase manufacturing jobs. “There’s an urge to regrow the manufacturing base the United States established in the 1950s and 1960s,” says economist Jared Franz. Beneficiaries may include construction and industrial companies tied to the build-out of data centres, autos and pharmaceuticals. For example, Caterpillar could see an increase in demand for its construction equipment, and Carrier Global’s heating and cooling systems, could also benefit.
It’s not just companies based in the U.S. that are taking part in this industrial renaissance. Looking forward, more companies may emulate Taiwan Semiconductor Manufacturing Company and Siemens by establishing operations in the United States to access the U.S. market.
Manufacturing could get a boost under an “America first” agenda

Sources: Capital Group, Bureau of Labor Statistics, U.S. Department of Labor. Figures are based on non-farm payrolls and are seasonally adjusted. As of December 31, 2024.
Franz notes that the United States’s enviable economy could likely withstand some bumps in the road related to tariffs and immigration as many of the impacts are targeted and hyper-local to a region or industry. For example, certain industries that rely heavily on immigration, such as homebuilders, could face labour shortages, which would lead to higher costs.
2. Deregulation could accelerate innovation
A new era of deregulation is expected to have sweeping impacts on the economy. Valuations are likely to rise and fall as investors digest the sometimes contradictory signals of tariffs and a looser regulatory environment.
Trump policies could accelerate innovation across artificial intelligence and possibly even pockets of health care, such as stem cell research which is of interest to the new Secretary of Health and Human Services, says portfolio manager Rich Wolf. Within AI, society could soon see a significant increase in robotics across commercial, residential and consumer sectors. Boston Dynamics, for example, creates robots for military, commercial and research applications.
Investors tend to underestimate the long-term impact of new technology

Sources: Morgan Stanley AI Guidebook: Fourth Edition, January 23, 2024; Next Move Strategy Consulting, Statista. Initial forecast dates were February 1996 for PC and internet users; January 2010 for smartphone shipments; March 2017 for cloud revenue; and January 2023 for AI market size.
Once a novelty, Waymo’s autonomous vehicles are now widespread throughout San Francisco and Los Angeles. The company is owned by Alphabet. Going forward, the key for the industry will be to scale profitability while maintaining the safety focus that builds trust with the public.
Many health care stocks remain under pressure as subsidies tied to the U.S. Affordable Care Act come under scrutiny. “Health care is a big lightning rod, but valuations are attractive for some companies within the sector,” Wolf says. For example, cell therapy companies and medical technology companies have largely sidestepped regulatory concerns. Medical technology companies developing products for robotic surgery include Intuitive Surgical and Stryker.
Trump has also pushed for a broad increase in defence spending among NATO members, which could benefit European-exposed aerospace and defence companies. Overall defence spending in the U.S. is unlikely to change, though budgets may move to newer technology like cyber, space and robotics.
3. Look to high-grade bonds for stable income opportunities
Inflation and an evolving mix of tariff and immigration policies have created market uncertainty. Given the strength of the U.S. economy, confidence that the Federal Reserve will lower interest rates this year has declined.
Absent a growth or inflation shock, interest rates are likely to remain near current levels, says fixed income portfolio manager Chitrang Purani.
The U.S. Consumer Price Index (CPI) hit 3% in January, up from its recent trough of 2.4% in September. Core CPI, which strips out food and energy, was 3.3%. Purani thinks inflation will gradually decline close to the Fed’s 2% target, but it may take longer than expected — especially if Trump’s more aggressive trade policies are implemented.
Diversification from equities appears to have returned for quality bonds
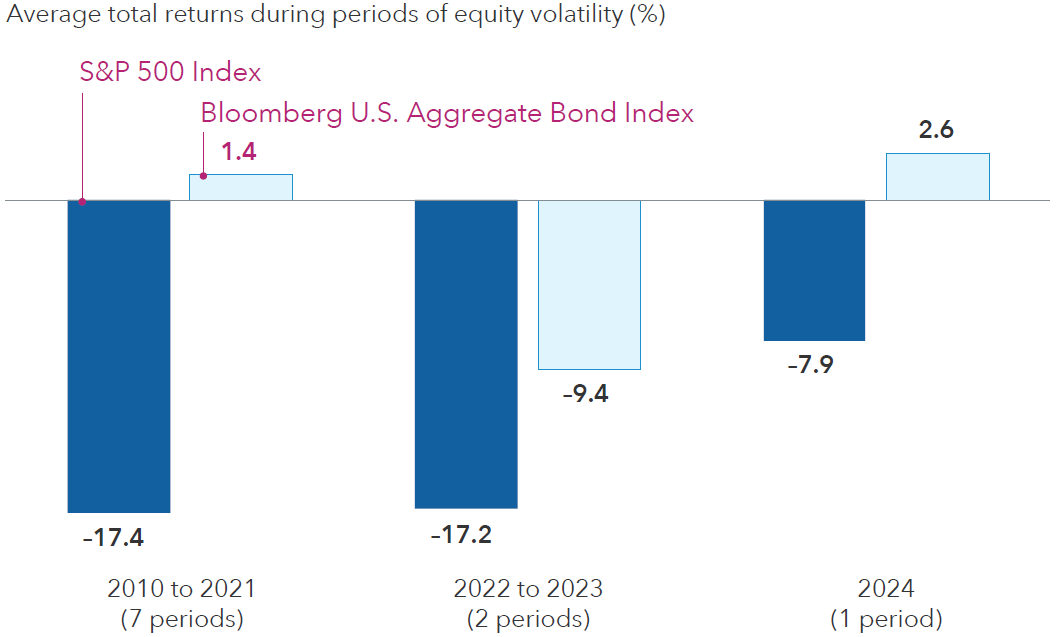
Sources: Capital Group, Morningstar. Periods of equity volatility from 2010 to 2023 are based on price declines of 10% or more (without dividends reinvested) in the S&P 500 with at least 75% recovery. The period of volatility during 2024 refers to July 15, 2024, through August 4, 2024. Returns are in USD.
“Identifying the winners and losers across sectors and issuers is more important than ever in this environment,” says Purani, who favours high-quality bonds over riskier, lower rated peers when constructing a core bond portfolio. That’s largely because credit valuations are tight across markets as investors have mostly priced in an optimistic growth scenario. Higher U.S. Treasury yields also translate to solid income potential, so investors don’t have to sacrifice quality. “Fortify your portfolios by improving quality in case we don’t get the growth outcome we expect — because it doesn’t cost a lot in terms of yields to do so.”
Bonds are also a compelling diversifier relative to cash and equities, Purani says. “Short and intermediate maturity Treasuries currently have attractive yields that largely price in the potential for stickier inflation and higher federal fund rates for longer. They also offer upside potential if we enter an environment where growth disappoints” In that scenario, Treasury yields may begin to fall, which would boost bond prices.
What’s next for investors
President Trump has implemented several policy changes that are likely to have lasting and complicated impacts on society and businesses. There is a risk these policies could have unintended consequences, and investors should be mindful of valuations amid the potential for heightened volatility.
Given high valuations and big gains in stocks over the past two years, it’s worth checking your risk tolerance against your portfolio holdings. “The investing world of the last few decades is fundamentally changing, but that doesn’t make things better or worse, it just raises uncertainty. If there’s one thing I’m reminded of though, it’s that markets and economies have shown resilience and continue to evolve and adapt,” Franz says.
Learn more about
The Magnificent Seven stocks consist of Alphabet, Amazon, Apple, Meta, Microsoft, NVIDIA and Tesla.
Consumer Price Index (CPI) is a measure of the average change over time in the prices paid by urban consumers for a market basket of consumer goods and services.
MSCI World Index is a free float-adjusted, market capitalization-weighted index designed to measure equity market results of developed markets. The index consists of more than 20 developed market country indexes, including the United States.
S&P 500 Index is a market capitalization-weighted index based on the results of approximately 500 widely held common stocks.
Bloomberg U.S. Aggregate Bond Index represents the U.S. investment-grade fixed-rate bond market.
©2025 Morningstar, Inc. All rights reserved. The information contained herein: (1) is proprietary to Morningstar and/or its content providers; (2) may not be copied or distributed; and (3) is not warranted to be accurate, complete or timely. Neither Morningstar nor its content providers are responsible for any damages or losses arising from any use of this information. Past performance is no guarantee of future results.
Our latest insights
-
-
Market Volatility
-
Markets & Economy
-
-
Market Volatility
RELATED INSIGHTS
-
Market Volatility
-
Global Equities
-
Commissions, trailing commissions, management fees and expenses all may be associated with investments in investment funds. Please read the prospectus before investing. Investment funds are not guaranteed or covered by the Canada Deposit Insurance Corporation or by any other government deposit insurer. For investment funds other than money market funds, their values change frequently. For money market funds, there can be no assurances that the fund will be able to maintain its net asset value per security at a constant amount or that the full amount of your investment in the fund will be returned to you. Past performance may not be repeated.
Unless otherwise indicated, the investment professionals featured do not manage Capital Group‘s Canadian investment funds.
References to particular companies or securities, if any, are included for informational or illustrative purposes only and should not be considered as an endorsement by Capital Group. Views expressed regarding a particular company, security, industry or market sector should not be considered an indication of trading intent of any investment funds or current holdings of any investment funds. These views should not be considered as investment advice nor should they be considered a recommendation to buy or sell.
Statements attributed to an individual represent the opinions of that individual as of the date published and do not necessarily reflect the opinions of Capital Group or its affiliates. This information is intended to highlight issues and not be comprehensive or to provide advice. For informational purposes only; not intended to provide tax, legal or financial advice. Capital Group funds are available in Canada through registered dealers. For more information, please consult your financial and tax advisors for your individual situation.
Forward-looking statements are not guarantees of future performance, and actual events and results could differ materially from those expressed or implied in any forward-looking statements made herein. We encourage you to consider these and other factors carefully before making any investment decisions and we urge you to avoid placing undue reliance on forward-looking statements.
The S&P 500 Composite Index (“Index”) is a product of S&P Dow Jones Indices LLC and/or its affiliates and has been licensed for use by Capital Group. Copyright © 2025 S&P Dow Jones Indices LLC, a division of S&P Global, and/or its affiliates. All rights reserved. Redistribution or reproduction in whole or in part are prohibited without written permission of S&P Dow Jones Indices LLC.
FTSE source: London Stock Exchange Group plc and its group undertakings (collectively, the "LSE Group"). © LSE Group 2025. FTSE Russell is a trading name of certain of the LSE Group companies. "FTSE®" is a trade mark of the relevant LSE Group companies and is used by any other LSE Group company under licence. All rights in the FTSE Russell indices or data vest in the relevant LSE Group company which owns the index or the data. Neither LSE Group nor its licensors accept any liability for any errors or omissions in the indices or data and no party may rely on any indices or data contained in this communication. No further distribution of data from the LSE Group is permitted without the relevant LSE Group company's express written consent. The LSE Group does not promote, sponsor or endorse the content of this communication. The index is unmanaged and cannot be invested in directly.
BLOOMBERG® is a trademark and service mark of Bloomberg Finance L.P. and its affiliates (collectively “Bloomberg”). Bloomberg or Bloomberg’s licensors own all proprietary rights in the Bloomberg Indices. Neither Bloomberg nor Bloomberg’s licensors approves or endorses this material, or guarantees the accuracy or completeness of any information herein, or makes any warranty, express or implied, as to the results to be obtained therefrom and, to the maximum extent allowed by law, neither shall have any liability or responsibility for injury or damages arising in connection therewith.
MSCI does not approve, review or produce reports published on this site, makes no express or implied warranties or representations and is not liable whatsoever for any data represented. You may not redistribute MSCI data or use it as a basis for other indices or investment products.
Capital believes the software and information from FactSet to be reliable. However, Capital cannot be responsible for inaccuracies, incomplete information or updating of the information furnished by FactSet. The information provided in this report is meant to give you an approximate account of the fund/manager's characteristics for the specified date. This information is not indicative of future Capital investment decisions and is not used as part of our investment decision-making process.
Indices are unmanaged and cannot be invested in directly. Returns represent past performance, are not a guarantee of future performance, and are not indicative of any specific investment.
All Capital Group trademarks are owned by The Capital Group Companies, Inc. or an affiliated company in Canada, the U.S. and other countries. All other company names mentioned are the property of their respective companies.
Capital Group funds are offered in Canada by Capital International Asset Management (Canada), Inc., part of Capital Group, a global investment management firm originating in Los Angeles, California in 1931. Capital Group manages equity assets through three investment groups. These groups make investment and proxy voting decisions independently. Fixed income investment professionals provide fixed income research and investment management across the Capital organization; however, for securities with equity characteristics, they act solely on behalf of one of the three equity investment groups.
The Capital Group funds offered on this website are available only to Canadian residents.