Active ETF popularity surges amid volatility

One early, potential winner of trade war volatility?


Actively managed exchange-traded funds (ETFs). The funds, which are managed by professionals who select among securities with the goal of outperforming a benchmark index, have seen a surge in assets amid early-year market volatility.


As the chart immediately below shows, flows into active ETFs of all kinds — equity, fixed income, specialty — have spiked in 2025 through March 31, reaching 42% of total Canadian-listed ETF flows. That puts active ETFs on course to reclaim some, if not all, of the ground lost since they last peaked in 2022 at 61% of total flows. Not uncoincidentally, that was during the last bout of major market volatility amid the COVID-19 pandemic, highlighting the negative correlation between active ETF investments and down markets.


“When markets fall, active ETF investments rise,” says Capital Group Canada senior product specialist Warner Wen, whose product focus is ETFs. 


Active ETF investments rise in step with volatility

This chart illustrates the percentage of active ETF flows relative to the total Canadian ETF flows from 2022 to 2025, year-to-date March 31, 2025. The data shows an inverse relationship with the MSCI ACWI (CAD) returns over the same period. In 2022, active ETF flows were 61% of total ETF flows while the MSCI ACWI return was -12.00%. In 2023, active ETF flows decreased to 52%, with the MSCI ACWI return increasing to 19.51%. In 2024, active ETF flows further decreased to 30%, with the MSCI ACWI return rising to 28.72%. As of March 31, 2025, active ETFs flows increased to 42%, while the MSCI ACWI return decreased to -1.15%.

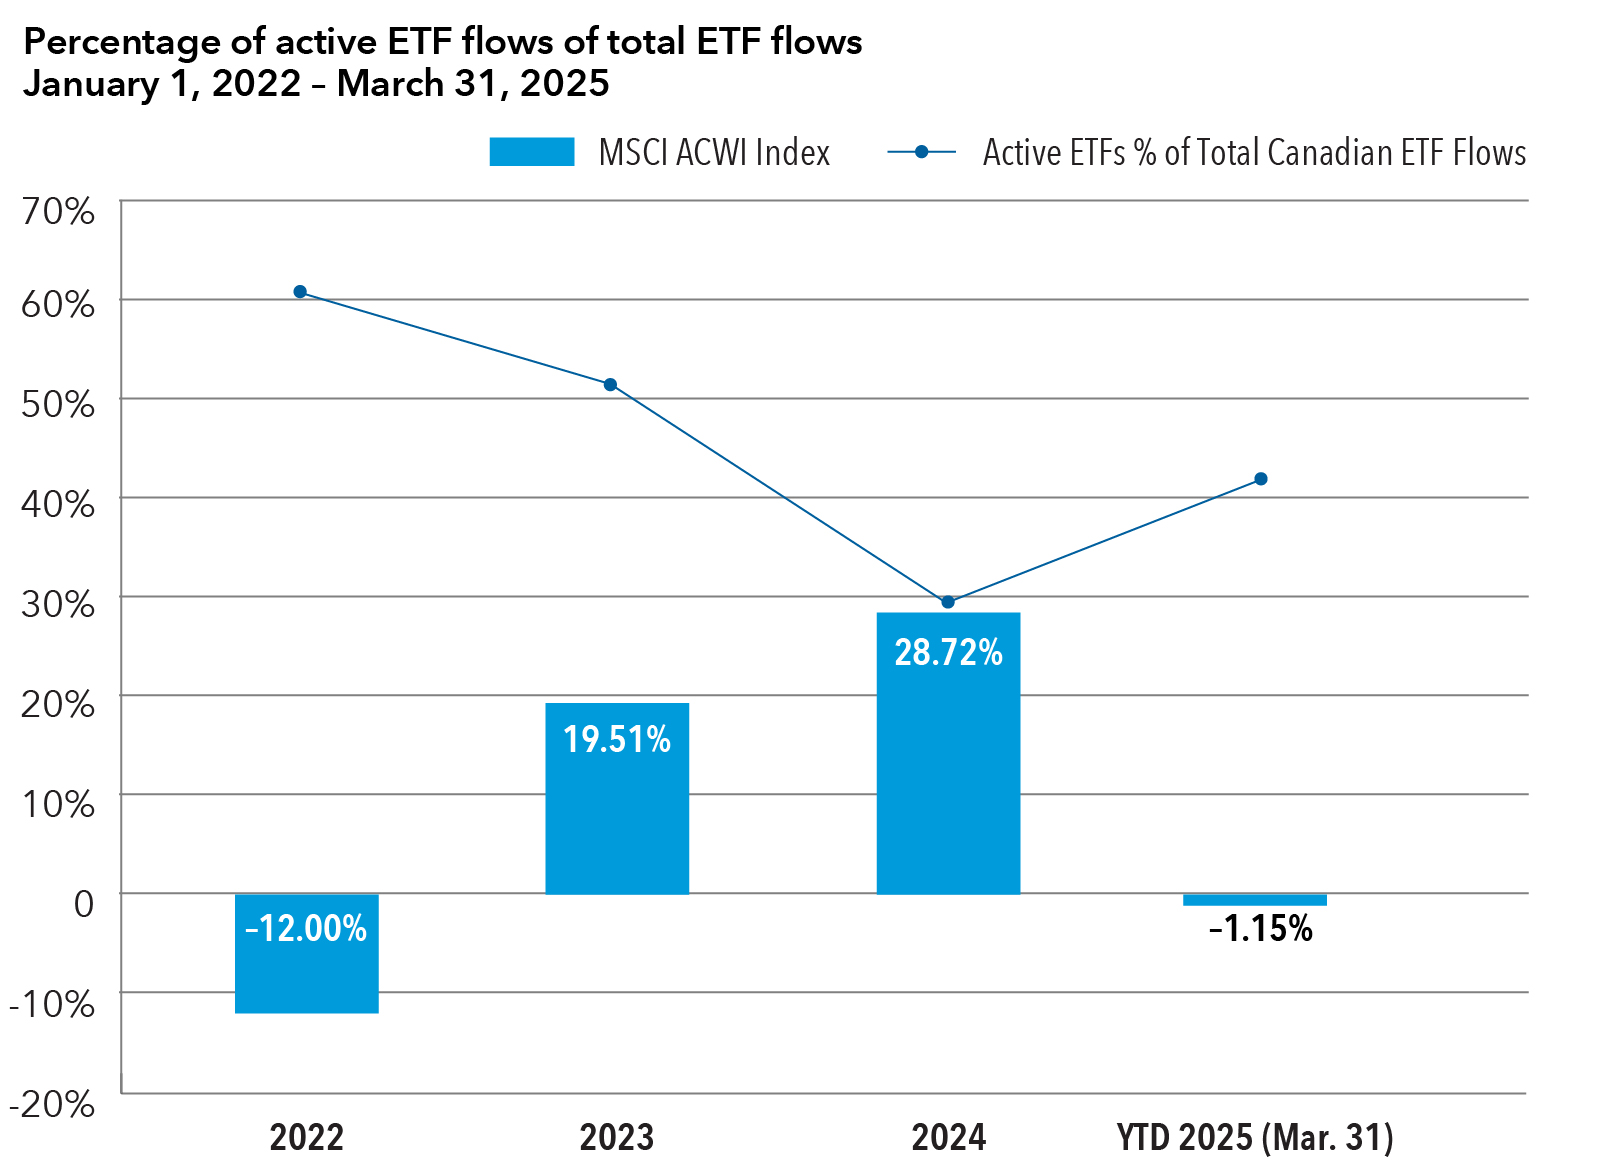
Sources: Capital Group, Morningstar Direct, MSCI.

The ability of active ETFs to invest in some — but not all — stocks in a benchmark appears to be an increasingly attractive option for investors who have watched many of the world’s leading passive equity indices fall through the first quarter, with U.S. stocks among the leaders on the downside. 


The pullback comes amid worries U.S. President Donald Trump’s aggressive trade policies will slow global growth while increasing prices for consumers in many countries. 


The early-year surge builds on the already impressive ascendancy of active ETFs in the Canadian market as illustrated by product growth in the chart below. It shows the growth in the number of active, passive and smart beta Canadian-listed ETFs over the past 10 years, with smart beta ETF holdings based on pre-determined or “smart” guidelines. 


In 2014 there were 91 active ETFs compared to 733 at the end of 2024, an increase of almost 800%. Over that time period, the number of active ETFs leapfrogged the number of passive ETFs, surpassing them by 40%. 


“Active ETF product growth is remarkable,” says Wen. 


Active ETFs up, up and away 

This chart depicts the growth in the number of Canadian ETFs from 2014 to 2024, categorized into active, passive and smart beta ETFs. The data highlights significant changes over the decade: In 2014, there were 91 active ETFs, 168 passive ETFs and 49 smart beta ETFs. By 2019, the numbers increased to 313 active ETFs, 281 passive ETFs and 151 smart beta ETFs. In 2024, growth continued with 733 active ETFs, 525 passive ETFs and 185 smart beta ETFs.

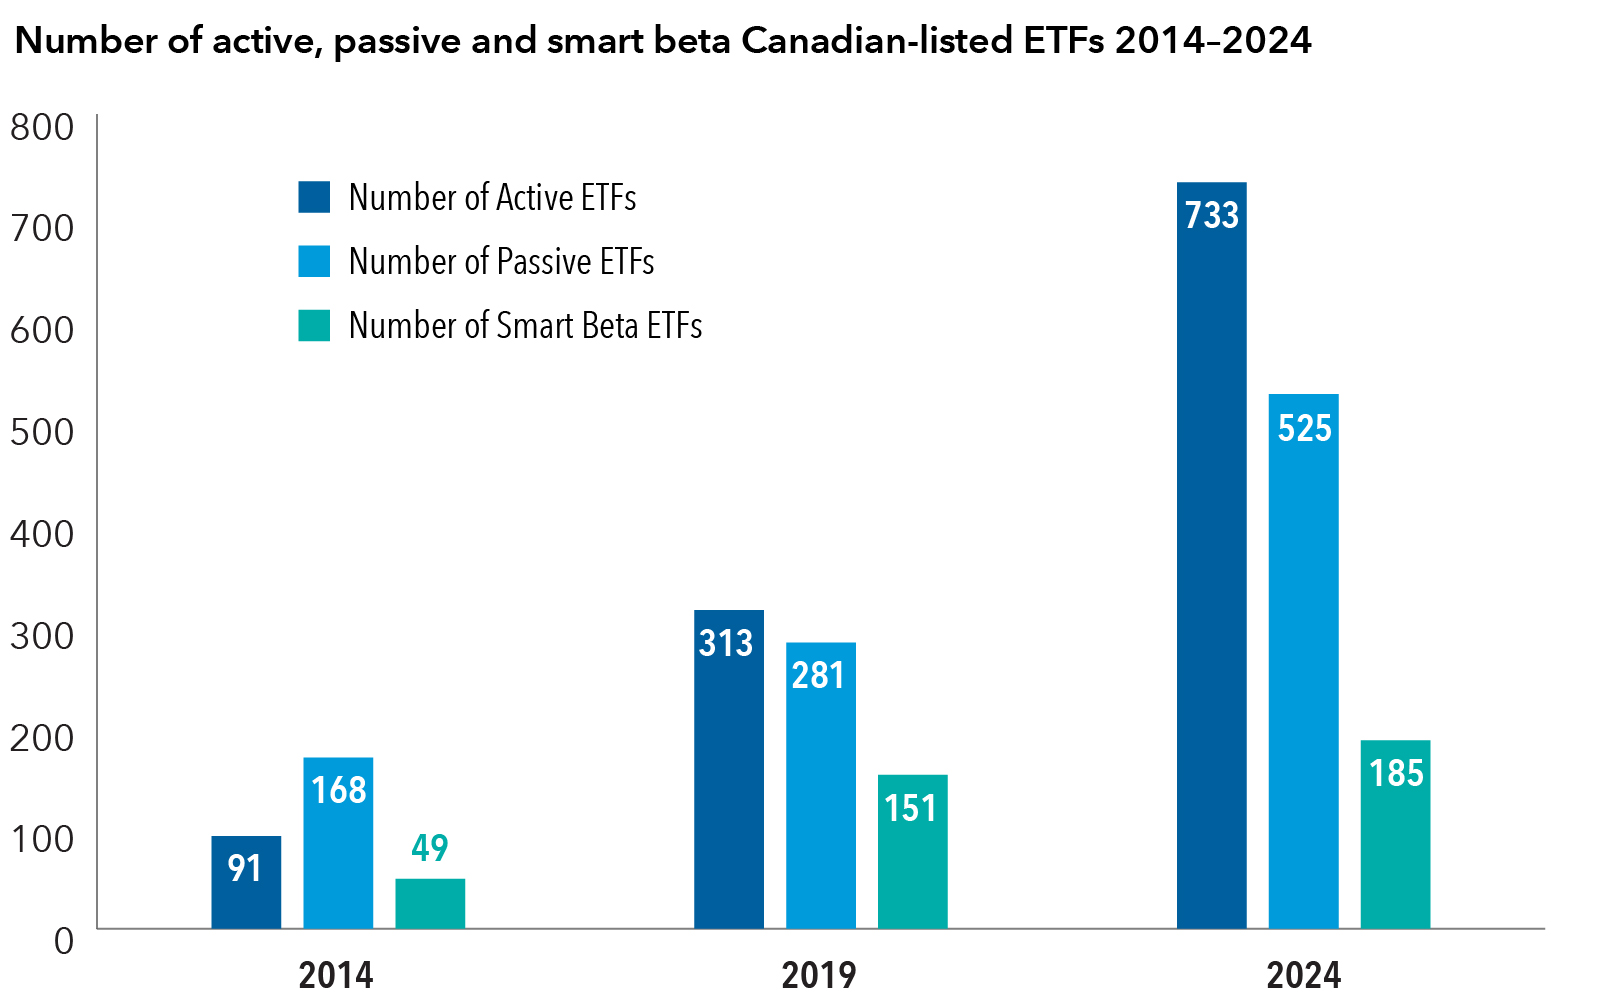
Source: Morningstar Direct.

In addition to being able to select which stocks to invest in, active ETFs are also able to hold stocks with smaller or larger footprints than a referent index. This may be another active ETF advantage that is resonating with investors after the selloff in the previously high-flying, U.S.-based Magnificent 7 tech-related companies. 


As the chart below shows, share prices of the individual companies that make up the so-called Magnificent 7 — Alphabet, Amazon, Apple, Meta, Microsoft, NVIDIA and Tesla — have significantly declined over the first quarter of 2025, with perhaps the exception of Meta, which still trended negative.  


Losing some of their Magnificence 

The bar chart shows the stock results of the Magnificent Seven companies year-to-date through March 31, 2025. The results for the seven companies are, as follows: Meta, down 1.5%; Microsoft, down 10.8%; Apple, down 11.2%; Amazon, down 13.3%, Alphabet, down 18.2%; NVIDIA, down 19.3% and Tesla, down 35.8%.

Source: Bloomberg. 

The selloff has not been lost on some passive ETF investors who may hold specialty index tracking investments in the Mag 7. More broadly, the group’s losses have also handicapped the Nasdaq, S&P 500 and MSCI All Country World Index — three major indices that have large exposures to the seven companies. 


Market declines do, as investors should know, reverse themselves over time, and some investors who may have opted for active ETFs amid this year’s early volatility may well return. Though this may take some of the steam out of the current upswing in adoption of active ETFs, other factors also appear to be tilting the scales in their favour.


Active is in for younger generations


One factor is the growing affinity for active ETFs among younger generations of investors, according to a recent, U.S.-based survey by the global Capital Group organization. In the survey, which was conducted between December 2024 and January 2025, nearly half of Gen Z, millennial and Gen X investors polled (45%) said they would be more likely to choose a financial professional who includes active ETFs in their investment approach. In fact, younger investors with US$100,000 to US$1 million in investable assets reported both awareness and a growing appetite for active ETFs.


Another factor is the increasing number of advisors and firms who are replacing traditional mutual funds with ETFs in model portfolios. According to Broadridge Financial Solutions, ETFs accounted for 51% of underlying assets in model portfolios in the U.S. at the end of last year, up from 46.7% in early 2022. Broadridge, a U.S.-based fintech company, puts the size of the U.S. model portfolio market at US$5.1 trillion. 


Model portfolios are standardized, pre-built investment portfolios that advisors can use to invest client money. They are optimized to conform to an investor’s goals, risk tolerance and investment time horizon, generally containing four to 20 underlying ETFs to create a diversified mix of holdings at the core of the portfolio.


Taking these two factors into account, it may be safe to say that industry trends point toward a bright future for active ETFs, at least for the near term. 


“Although passive burst out of the ETF starting gate well ahead of active, the long race is revealing a quickly lessening gap,” says Wen.


Commissions, trailing commissions, management fees and expenses all may be associated with investments in investment funds. Please read the prospectus before investing. Investment funds are not guaranteed or covered by the Canada Deposit Insurance Corporation or by any other government deposit insurer. For investment funds other than money market funds, their values change frequently. For money market funds, there can be no assurances that the fund will be able to maintain its net asset value per security at a constant amount or that the full amount of your investment in the fund will be returned to you. Past performance may not be repeated.

Capital Group exchange-traded funds (ETFs) are actively managed and do not seek to replicate a specific index. ETF units are bought and sold through an exchange at the then current market price, not net asset value (NAV), and are not individually redeemed from the fund. Units may trade at a premium or discount to their NAV when traded on an exchange. Brokerage commissions will reduce returns. There can be no guarantee that an active market for ETFs will develop or be maintained, or that the ETF's listing will continue or remain unchanged.

The ETFs are prospectus qualified in Canada and are not registered with the United States Securities and Exchange Commission and are not intended for distribution in the United States.

Unless otherwise indicated, the investment professionals featured do not manage Capital Group‘s Canadian investment funds.

References to particular companies or securities, if any, are included for informational or illustrative purposes only and should not be considered as an endorsement by Capital Group. Views expressed regarding a particular company, security, industry or market sector should not be considered an indication of trading intent of any investment funds or current holdings of any investment funds. These views should not be considered as investment advice nor should they be considered a recommendation to buy or sell.

Statements attributed to an individual represent the opinions of that individual as of the date published and do not necessarily reflect the opinions of Capital Group or its affiliates. This information is intended to highlight issues and not be comprehensive or to provide advice. For informational purposes only; not intended to provide tax, legal or financial advice. Capital Group funds are available in Canada through registered dealers. For more information, please consult your financial and tax advisors for your individual situation.

Forward-looking statements are not guarantees of future performance, and actual events and results could differ materially from those expressed or implied in any forward-looking statements made herein. We encourage you to consider these and other factors carefully before making any investment decisions and we urge you to avoid placing undue reliance on forward-looking statements.

The S&P 500 Composite Index (“Index”) is a product of S&P Dow Jones Indices LLC and/or its affiliates and has been licensed for use by Capital Group. Copyright © 2025 S&P Dow Jones Indices LLC, a division of S&P Global, and/or its affiliates. All rights reserved. Redistribution or reproduction in whole or in part are prohibited without written permission of S&P Dow Jones Indices LLC.

FTSE source: London Stock Exchange Group plc and its group undertakings (collectively, the "LSE Group"). © LSE Group 2025. FTSE Russell is a trading name of certain of the LSE Group companies. "FTSE®" is a trade mark of the relevant LSE Group companies and is used by any other LSE Group company under licence. All rights in the FTSE Russell indices or data vest in the relevant LSE Group company which owns the index or the data. Neither LSE Group nor its licensors accept any liability for any errors or omissions in the indices or data and no party may rely on any indices or data contained in this communication. No further distribution of data from the LSE Group is permitted without the relevant LSE Group company's express written consent. The LSE Group does not promote, sponsor or endorse the content of this communication. The index is unmanaged and cannot be invested in directly.

BLOOMBERG® is a trademark and service mark of Bloomberg Finance L.P. and its affiliates (collectively “Bloomberg”). Bloomberg or Bloomberg’s licensors own all proprietary rights in the Bloomberg Indices. Neither Bloomberg nor Bloomberg’s licensors approves or endorses this material, or guarantees the accuracy or completeness of any information herein, or makes any warranty, express or implied, as to the results to be obtained therefrom and, to the maximum extent allowed by law, neither shall have any liability or responsibility for injury or damages arising in connection therewith.

MSCI does not approve, review or produce reports published on this site, makes no express or implied warranties or representations and is not liable whatsoever for any data represented. You may not redistribute MSCI data or use it as a basis for other indices or investment products.

Capital believes the software and information from FactSet to be reliable. However, Capital cannot be responsible for inaccuracies, incomplete information or updating of the information furnished by FactSet. The information provided in this report is meant to give you an approximate account of the fund/manager's characteristics for the specified date. This information is not indicative of future Capital investment decisions and is not used as part of our investment decision-making process.

Indices are unmanaged and cannot be invested in directly. Returns represent past performance, are not a guarantee of future performance, and are not indicative of any specific investment.

All Capital Group trademarks are owned by The Capital Group Companies, Inc. or an affiliated company in Canada, the U.S. and other countries. All other company names mentioned are the property of their respective companies.

Capital Group funds are offered in Canada by Capital International Asset Management (Canada), Inc., part of Capital Group, a global investment management firm originating in Los Angeles, California in 1931. Capital Group manages equity assets through three investment groups. These groups make investment and proxy voting decisions independently. Fixed income investment professionals provide fixed income research and investment management across the Capital organization; however, for securities with equity characteristics, they act solely on behalf of one of the three equity investment groups.

The Capital Group funds offered on this website are available only to Canadian residents.