More than 30,000.
That’s the approximate number of securities in the Bloomberg Global Aggregate Bond Index. The multi-currency, global bond index invests in U.S. Treasuries, government-related issues, and corporate and securitized bonds from both developed and emerging markets. Although it may be theoretically possible to buy all of the bonds in the index in the same amounts, with the same duration and credit quality, as passive fixed income ETFs attempt to do, an increasing number of investors are instead choosing an active fixed income ETF, global or otherwise.
To illustrate, of the total $114 billion in long-term Canadian-listed fixed income ETFs, $31.6 billion has found its way into active fixed income ETFs, or about 28% of the total. That’s up from $12.8 billion just five years ago, with all figures from Morningstar dated June 30, 2024.
Active vs. passive ETFs
Actively managed ETFs share many of the same capabilities as passive index-tracking ETFs — intraday trading, liquidity and cost efficiency — but with some key differences. Active ETFs give the portfolio manager the flexibility to diversify away from certain securities that may be a large part of the index or to hold issuers with no, or a much smaller footprint in the index, to seek better, more targeted outcomes for investors.
In the case of the Bloomberg Global Aggregate Bond Index more than half its holdings are concentrated in U.S. Treasuries, with a 55.4% allocation as of June 30, 2024. The significant weight to both Treasuries and the U.S. is a byproduct of the index’s cap-weighted methodology for exposures. Put simply, the most indebted issuers — in this case the U.S. government — are allotted a bigger portion of the index due to the way in which it determines security weights. This in turn leads to higher levels of concentration in one security, which goes against a cardinal rule of investing: don’t put all your eggs in one basket.
Investment flexibility
Concentration worries aside, active fixed income ETF portfolio managers have the ability to adjust holdings and position a portfolio in response to changing market conditions and investment outlooks. This investment flexibility enables portfolio managers to seek better-than-market outcomes and potentially better protection on the downside when markets are falling.
The importance of being flexible in fixed income holdings and exposures is underlined by the varying results across higher income sectors. The quilt chart below illustrates how quickly and how often market leadership changes from year to year across four bond categories: U.S. high yield, investment-grade corporates, emerging markets debt and securitized debt. As shown, almost every year heralds a new leader, which partly explains the growing attraction to active fixed income ETFs, as they “actively” seek the market leaders of tomorrow.
Within higher income, no single sector posted a higher return each year
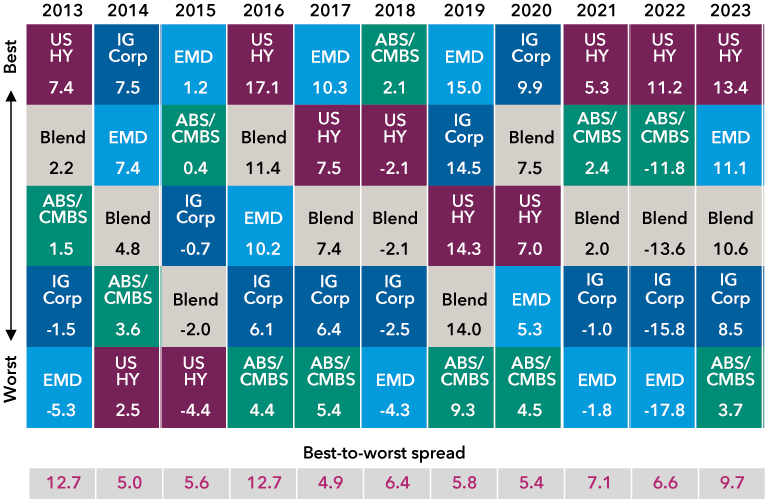
Data as of December 31, 2023, and returns are in USD. U.S. HY represents Bloomberg U.S. Corporate High Yield 2% Issuer Capped Index; IG Corp represents Bloomberg U.S. Corporate Investment Grade Index; EMD represents JPMorgan EMBI Global Diversified Index; ABS/CMBS represents 80% Bloomberg CMBS Ex AAA Index /20% Bloomberg ABS Ex AAA Index. Blend is Multi-Sector Income Fund Custom Index, which comprises: 45% Bloomberg U.S. Corporate High Yield 2% Issuer Capped Index; 30% Bloomberg U.S. Corporate Investment Grade Index; 15% J.P. Morgan EMBI Global Diversified Index; 8% Bloomberg CMBS Ex AAA Index to September 30, 2023, and 8% Bloomberg Non-Agency CMBS Ex AAA Index thereafter; and, 2% Bloomberg ABS Ex AAA Index.
Active ETFs as part of a bond toolkit
Actively seeking the market leaders of tomorrow is what Capital Group’s more than 200 fixed income investment professionals (portfolio managers, investment analysts and traders) attempt to do, bringing their highest conviction ideas into our active fixed income ETFs.
Plus, liquidity sourcing, another concern in fixed income markets, is one of Capital Group’s core capabilities that comes from our scale (US$515 billion in fixed income assets under management globally as of June 30, 2024) and decades of experience. Our fixed income portfolio managers are able to access new issues across fixed income markets that may not be fully available to retail investors or smaller ETF issuers who may be constrained by limited resources to evaluate them. Our traders leverage their deep relationships to source investments which portfolio managers believe may add value for unitholders.
Broad fixed income capabilities
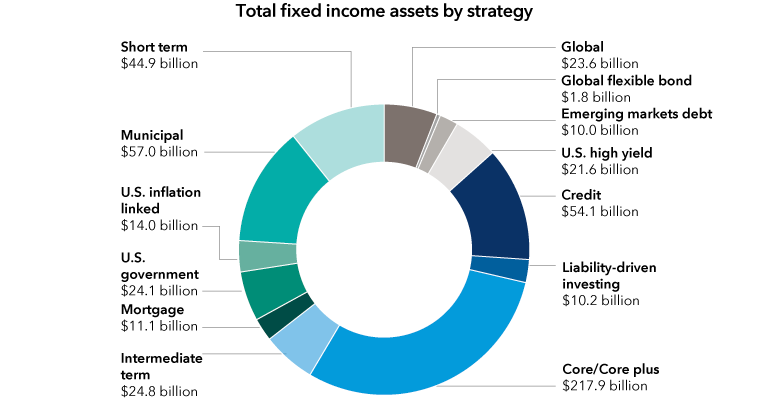
Capital Group's fixed income assets under management, as of June 30, 2024. Reflects the Capital Group global organization. Assets managed by Capital Fixed Income Investors. Values in USD. Totals may not reconcile due to rounding.
Capital Group has two active fixed income ETFs designed to strengthen the core of a portfolio.