Market Volatility
Markets & Economy
Just seven companies have kept the S&P 500 Index afloat this year, with Apple, Meta, Microsoft, NVIDIA, Amazon, Alphabet and Tesla driving the vast majority of gains. Stretched valuations are also a concern for some investors: While not as wide as recent history, current forward price-to-earnings ratio on the top 20 stocks in the S&P 500 Index are roughly 42% higher than the overall market.
In terms of index concentration, Apple and Microsoft stand out with weights of 7.7% and 6.8%, respectively, as of June 30 — more than double that of Alphabet, the third-largest holding, at 3.6%. This dynamic is self-reinforcing. Higher stock prices can fuel market capitalization gains and index recalculations, which in turn fuel additional inflows to these stocks as millions of investors in passive funds make their regular contributions under defined contribution plans, perpetuating the cycle.
Outsized impact of the “Magnificent Seven” stocks to returns
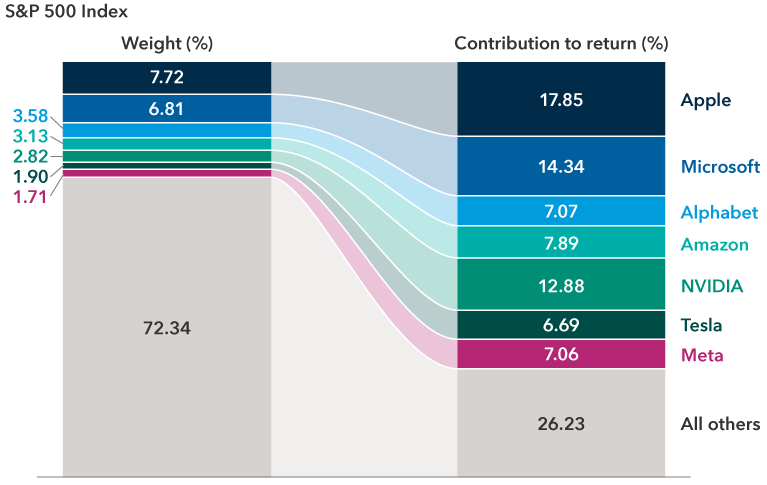
Source: FactSet. Weighted values for Apple, Microsoft, Alphabet, Amazon, NVIDIA, Tesla and Meta as of June 30, 2023. Contribution to return calculated from January 2, 2023, to June 30, 2023. Based in USD.
This “bad breadth” is challenging the industry in a way that hasn’t been seen in roughly 40 years. The Nasdaq 100 Index underwent a “special rebalance” in late July for only the third time in its history to address over-concentration and avoid breaching U.S. Securities and Exchange Commission rules on fund diversification. In a related action tied to regulatory guidelines, some of the largest U.S. investment funds are being blocked from buying more shares of these companies.
And it’s challenging for end investors in unexpected ways. For one, there is evidence this situation can increase overall portfolio risk, especially for passive investors. It is made worse by the business similarities of the companies leading the market higher — magnifying concentration risk. But there are few steps investors can take to help mitigate the risk.
One doesn’t need to be a professional equity analyst to understand that these seven companies have more in common than not. All are exposed, in various ways, to secular trends like the rapid evolution of artificial intelligence (AI) applications, augmented reality/virtual reality, autonomous vehicles and more. Zooming out, the top 20 stocks in the S&P 500 are dominated by two sectors (communication services and information technology). Sectors excluded entirely include materials, utilities and real estate.
This overlap means that despite their unique businesses and idiosyncratic characteristics, a large part of their return potential will be based on common risk factors. In comparing the risks unique to the company (security-specific risks), the top 10 or 20 stocks versus the broader S&P 500 Index are less diversified as they are more concentrated in certain sectors. Thus, the diversification benefit offered by holding these specific stocks — alone or within a passive, indexed strategy — is greatly diminished.
Many risk factors overlap and contribute to total risk
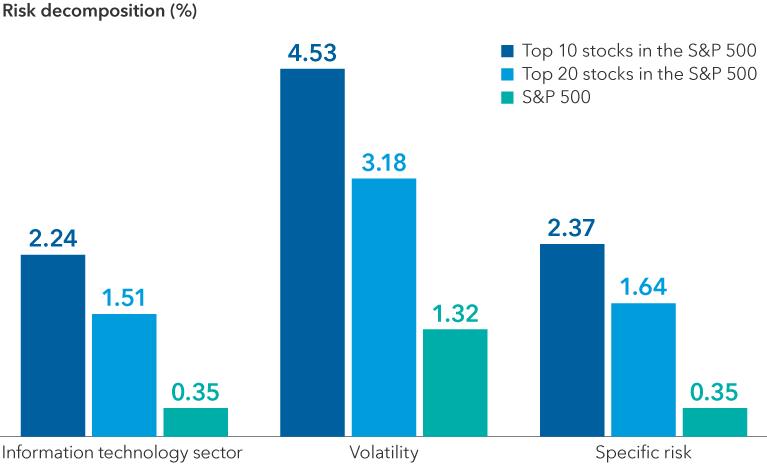
Source: MSCI BarraOne. Risk decomposition based on the MSCI Multi-Asset Class Long (MAC.L) Factor risk Model Tier 3 as of 6/30/2023, accessed on 7/14/2023; S&P 500 Index holdings as of 6/30/2023. Risk decomposition is the breakdown of various factors to analyze sources of risk in a portfolio or index. This exhibit reflects the sector risk from the information technology sector, risk from volatility measures and specific risk attributed to a hazard applicable to a particular company.
When an index loses its lustre
Another useful way to look at the increasing narrowness of the U.S. equity market is through a measure that antitrust regulators use to gauge market concentration within an industry, the Herfindahl-Hirschman Index (HHI). The index allows us to answer the following hypothetical: Let’s say you wanted to create an equally weighted portfolio of stocks that would provide the same level of diversification as the market-cap weighted S&P 500 Index. How many stocks would there be in that hypothetical portfolio? This number is called the “effective number of constituents” (ENC) in an index, an inverse of the HHI. The answer is 60 stocks (as of June 30, 2023). Because the S&P 500 Index is so highly concentrated, it isn’t providing any more diversification than a portfolio of 60 equally weighted stocks, according to the HHI measure.
Effective number of securities in the S&P 500 Index has decreased significantly
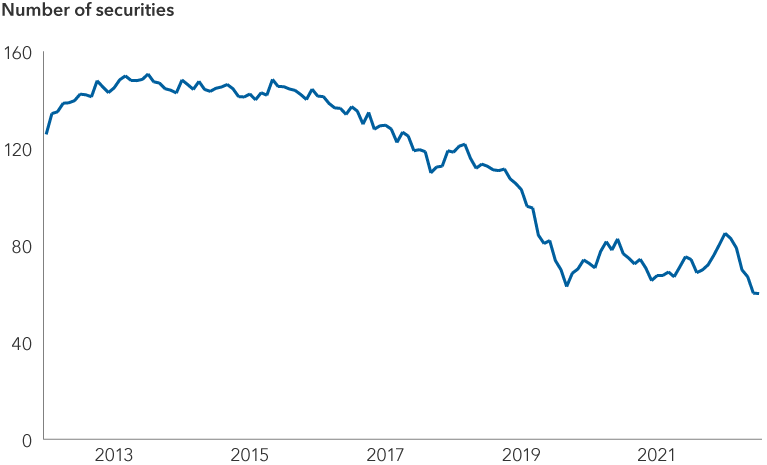
Source: FactSet as of June 30, 2023.
Diversification disappointment grows
If it weren’t enough that the diversification power of the equity portion of many investor portfolios had eroded, the diversification typically achieved with a bond allocation is somewhat diminished as well. Since December 2012, over rolling 90-day periods, higher market concentration was associated with higher correlations between stocks and bonds. That is, stocks and bonds tended to move more in unison and, as a result, the overall diversification benefit of a typical mixed asset portfolio was reduced on the margin. As a result, should markets turn lower, investors could be hit with a less diversified equity investment.
Narrow markets reduce diversification potential
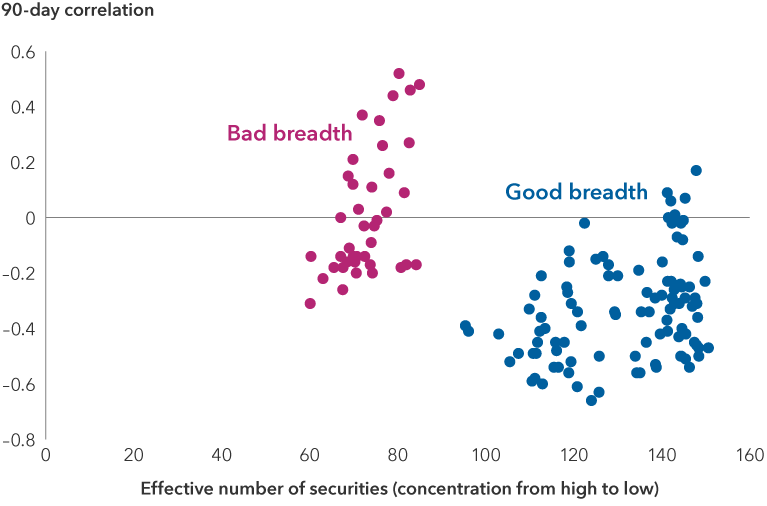
Source: Factset as of June 30, 2023. Stock-bond trailing 90-day correlation from rolling month end starting from December 2012, as represented by the S&P 500 Index and the Bloomberg U.S. Aggregate Bond Index, respectively. There are 38 values of ”bad breadth” or high concentration, denoted by having less than 84 effective number of securities. The remaining 101 values or ”good breadth” are scattered in a low concentration as denoted with greater than 84 effective number of securities.
Narrow market rallies tend to widen over time
To be clear, the situation is far from dire, and there is some evidence that narrow market rallies have often been followed by steady gains for the broader market. However, investors must consider that should euphoria over AI subside, a pullback in tech stocks could stifle a broader rally. As of June 30, nearly all 11 sectors in the S&P 500 generated positive results in U.S. dollar terms for the quarter to date, but the price-to-earnings ratio for the S&P 500 technology sector was 27.1 times earnings as of June 30, compared with 18.9 times earnings for the broader S&P 500.
Average S&P 500 Index returns following significant declines in market breadth
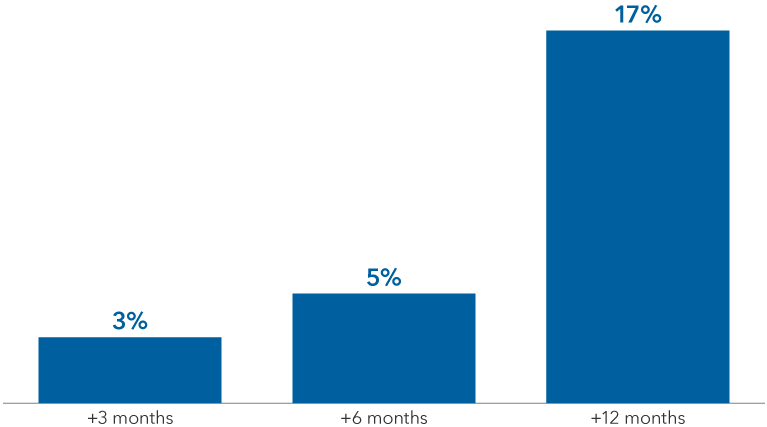
Sources: Capital Group, Refinitiv Datastream, Standard & Poor's. As of July 5, 2023. Significant declines in market breadth are measured as dates upon which the ratio of the equal-weighted S&P 500 Index to the market-cap weighted S&P 500 Index falls below the first quintile of the total range between December 31, 2004, and July 5, 2023. Returns are in USD.
What can investors do?
There are a few steps investors can consider:
- In an asset allocation program or in multi-asset portfolios, increase fixed income exposure to targeted goals or policy.
- Within the fixed income allocation, ensure that a sizable portion is conservative and as uncorrelated with equities as possible.
- Within the equity allocation, consider allocating to dividend-oriented strategies as an offset to risks in growth-oriented strategies.
- Allocate to actively-managed U.S. equities strategies that may not be so concentrated, even if they may lag in a momentum-driven market.
Current forward price-to-earnings (P/E) ratio is a current stock’s price over “predicted” earnings per share. P/E ratios are used to determine the relative value of a company’s shares against similar companies within the same industry or a single company across a period of time. A high P/E ratio may imply that a company’s stock is overvalued or investors are expecting high growth rates in the future.
A passive fund is an investment vehicle with minimal trading, that tracks a market index or a market segment, to determine what to invest in. An actively managed fund or strategy rely on a single fund manager or group of fund managers making investment decisions in an attempt to surpass an index over time.
A factor is a characteristic relating to a group of securities that can help explain their risk and return. Certain factors have historically earned a long-term risk premium and represent exposure to systematic sources of risk.
The HHI takes each index constituent’s percentage weight in the index, squares it and sums them up. (The higher the index, the greater the concentration). Taking the inverse of this total gives the “effective number” of constituents.
Correlation is a statistical measure of how a security and an index move in relation to each other. A correlation ranges from negative 1 to 1. A positive correlation close to 1 implies that as one moves, either up or down, the other will move in “lockstep,” in the same direction. A negative correlation close to negative1 indicates the two have moved in opposite directions.
In an equal-weighted index or portfolio, securities have the same weight or representation. In a market-weighted portfolio, the market gains or losses affect each security's weighting in the index.
The Bloomberg U.S. Aggregate Bond Index represents the U.S. investment-grade fixed-rate bond market.
The S&P 500 Index is a market capitalization-weighted index based on the results of approximately 500 widely held common stocks.
Our latest insights
-
-
Market Volatility
-
Markets & Economy
-
-
Market Volatility
RELATED INSIGHTS
-
Demographics & Culture
-
International Equities
-
Market Volatility
Commissions, trailing commissions, management fees and expenses all may be associated with investments in investment funds. Please read the prospectus before investing. Investment funds are not guaranteed or covered by the Canada Deposit Insurance Corporation or by any other government deposit insurer. For investment funds other than money market funds, their values change frequently. For money market funds, there can be no assurances that the fund will be able to maintain its net asset value per security at a constant amount or that the full amount of your investment in the fund will be returned to you. Past performance may not be repeated.
Unless otherwise indicated, the investment professionals featured do not manage Capital Group‘s Canadian investment funds.
References to particular companies or securities, if any, are included for informational or illustrative purposes only and should not be considered as an endorsement by Capital Group. Views expressed regarding a particular company, security, industry or market sector should not be considered an indication of trading intent of any investment funds or current holdings of any investment funds. These views should not be considered as investment advice nor should they be considered a recommendation to buy or sell.
Statements attributed to an individual represent the opinions of that individual as of the date published and do not necessarily reflect the opinions of Capital Group or its affiliates. This information is intended to highlight issues and not be comprehensive or to provide advice. For informational purposes only; not intended to provide tax, legal or financial advice. Capital Group funds are available in Canada through registered dealers. For more information, please consult your financial and tax advisors for your individual situation.
Forward-looking statements are not guarantees of future performance, and actual events and results could differ materially from those expressed or implied in any forward-looking statements made herein. We encourage you to consider these and other factors carefully before making any investment decisions and we urge you to avoid placing undue reliance on forward-looking statements.
The S&P 500 Composite Index (“Index”) is a product of S&P Dow Jones Indices LLC and/or its affiliates and has been licensed for use by Capital Group. Copyright © 2025 S&P Dow Jones Indices LLC, a division of S&P Global, and/or its affiliates. All rights reserved. Redistribution or reproduction in whole or in part are prohibited without written permission of S&P Dow Jones Indices LLC.
FTSE source: London Stock Exchange Group plc and its group undertakings (collectively, the "LSE Group"). © LSE Group 2025. FTSE Russell is a trading name of certain of the LSE Group companies. "FTSE®" is a trade mark of the relevant LSE Group companies and is used by any other LSE Group company under licence. All rights in the FTSE Russell indices or data vest in the relevant LSE Group company which owns the index or the data. Neither LSE Group nor its licensors accept any liability for any errors or omissions in the indices or data and no party may rely on any indices or data contained in this communication. No further distribution of data from the LSE Group is permitted without the relevant LSE Group company's express written consent. The LSE Group does not promote, sponsor or endorse the content of this communication. The index is unmanaged and cannot be invested in directly.
BLOOMBERG® is a trademark and service mark of Bloomberg Finance L.P. and its affiliates (collectively “Bloomberg”). Bloomberg or Bloomberg’s licensors own all proprietary rights in the Bloomberg Indices. Neither Bloomberg nor Bloomberg’s licensors approves or endorses this material, or guarantees the accuracy or completeness of any information herein, or makes any warranty, express or implied, as to the results to be obtained therefrom and, to the maximum extent allowed by law, neither shall have any liability or responsibility for injury or damages arising in connection therewith.
MSCI does not approve, review or produce reports published on this site, makes no express or implied warranties or representations and is not liable whatsoever for any data represented. You may not redistribute MSCI data or use it as a basis for other indices or investment products.
Capital believes the software and information from FactSet to be reliable. However, Capital cannot be responsible for inaccuracies, incomplete information or updating of the information furnished by FactSet. The information provided in this report is meant to give you an approximate account of the fund/manager's characteristics for the specified date. This information is not indicative of future Capital investment decisions and is not used as part of our investment decision-making process.
Indices are unmanaged and cannot be invested in directly. Returns represent past performance, are not a guarantee of future performance, and are not indicative of any specific investment.
All Capital Group trademarks are owned by The Capital Group Companies, Inc. or an affiliated company in Canada, the U.S. and other countries. All other company names mentioned are the property of their respective companies.
Capital Group funds are offered in Canada by Capital International Asset Management (Canada), Inc., part of Capital Group, a global investment management firm originating in Los Angeles, California in 1931. Capital Group manages equity assets through three investment groups. These groups make investment and proxy voting decisions independently. Fixed income investment professionals provide fixed income research and investment management across the Capital organization; however, for securities with equity characteristics, they act solely on behalf of one of the three equity investment groups.
The Capital Group funds offered on this website are available only to Canadian residents.
 Steve Fox