 Jayme Colosimo
 Harry Phinney
 Natalya Zeman
Market Volatility
Categories
Trade
Tariffs explained: Assessing the global economic impact
The much-anticipated “Liberation Day” on April 2 provided investors with more details on the direction of U.S. trade policy under the Trump administration. Despite hopes of a more moderate approach, the tariffs were worse than expected overall, though Canada did get something of a reprieve as the country escaped across-the-board levies applied to all Canadian goods. Trump did, however, go ahead with a 25% tariff on "all foreign-made" automobiles as of midnight April 2, which could have severe implications for the Canadian auto sector. Previously announced tariffs also remain in place for steel and aluminum as does a 25% tariff on goods not compliant with USMCA.
All told, the moves raise the prospect of lower economic growth, higher inflation and interest rate cuts in Canada. U.S. and Canadian equity markets sold off sharply on the news, while European and Asian markets also fell.
A lasting scenario with tariffs on the high end of initial proposals could tip the U.S. and the global economy toward a recession. Retaliatory tariffs from Canada, the European Union, China and a range of other countries remains a concern as do counter retaliatory tariffs from the U.S.
A key caveat is whether tariffs are being used as a bargaining tactic. We suspect that the newly announced numbers are an opening salvo for negotiations and won’t likely serve as a roadmap of what tariffs could be in six to 12 months. Still, current rhetoric and near-term economic implications make us cautious. It is still too early to draw definitive conclusions about the impact on economic growth and inflation, given the broad spectrum of sectors and countries impacted by the new policies.
Source: Capital Group as of April 2, 2025
1. What are President Trump’s tariff goals?
The latest tariff announcements from the Trump administration signal a significant shift in U.S. posture toward global trade. Initially, tariffs focused on foreign policy, border security and drug trafficking, but recent proposals emphasize protectionist measures to address trade imbalances that the administration believes are unfair. In his April 2 tariff order, Trump declared “foreign trade and economic practices have created a national emergency.”
Besides correcting perceived unfavourable trade dynamics, other goals have emerged, such as increasing tariff revenue to offset the cost of planned tax cuts.
Sources: Capital Group, American Compass. As of March 5, 2025.
2. How effective will tariffs be in achieving these goals?
Tariffs can contribute to the geopolitical goals of decoupling, negotiating and generating revenue (although they are effectively a regressive tax), but rebalancing might be harder to achieve. In the short term, the trade balance might see some improvement, but over time, exchange rates, interest rates and relative prices adjust to balance savings, investment and production.
Ultimately, tariffs are more likely to reduce the volume of trade with a given country without altering the overall trade balance itself. For example, although U.S. imports from China significantly decreased in 2018 and 2019, this decline was largely compensated by increased imports from other countries.
3. How will tariffs impact economic activity and markets?
Analyzing the effects of U.S. tariffs is difficult, as the impact will largely depend on specifics, such as the goals, products involved, new rates and any possible exemptions. There are also the potential policy responses from other countries, including retaliation, bilateral trade deals and potentially lowering trade barriers to ease restrictions on U.S. companies in global markets. Finally, modeling the impact of tariffs relies heavily on various assumptions and potential policy responses in each country.
Here is a broad overview in which to think about the possible impact:
Growth: Tariffs generally act like a negative supply shock, raising the price level and limiting growth through various mechanisms. These mechanisms can cause companies to postpone their investments and reduce household purchasing power.
The extent of these negative impacts on growth will depend on several factors, including the duration of the higher tariffs, the nature of retaliatory and counter- retaliatory actions, the efficiency of tariff collection and the feedback effects in global financial conditions.
Looking back at President Donald Trump’s first term, U.S. GDP growth still averaged 2.7% from 2017 to 2019, despite the trade war. However, this might have been because tariffs did not end up being significant. U.S. customs duties collected doubled between 2017 and 2019, but the increase only accounted for 0.2% of GDP at the time.
Inflation: Raising the cost of imported goods could lead companies to pass those prices onto consumers. These tariffs may reduce international competition, giving domestic producers more runway to raise prices themselves, exacerbating inflation pressures. A common estimate is that 30% to 50% of the cost will be passed onto consumers, though the rate may be higher for products with fewer substitutes.
Whether this translates into sustained inflation depends on the U.S. Federal Reserve’s response to this price level shock. Fed officials could overlook a one-time price increase caused by higher tariffs, but if core inflation moves too far from the central bank’s target, it could justify postponing rate cuts.
4. Does Trump have the legal authority to keep raising tariffs?
The newly announced reciprocal tariffs invoke the authority of the International Emergency Economic Powers Act (IEEPA), the National Emergencies Act and the Trade Act of 1974, based on a declared emergency related to “large and persistent annual U.S. goods trade deficits.” Other tariffs have been implemented with a stated intent of combatting emergencies related to illegal immigration and illicit drugs.
Using these measures to impose tariffs is unprecedented and will likely face legal challenges, but courts have generally deferred to the president on tariffs and national security. During Trump’s first term, some tariffs were temporarily blocked, but none were reversed by the courts. Congress could also move to rein in the executive branch’s power to unilaterally implement tariffs, although no such actions were taken under the first Trump administration. Senators Chuck Grassley and Maria Cantwell introduced bipartisan legislation on April 3 that would require congressional approval for new tariffs, but it remains to be seen if the measure goes anywhere.
What might change Trump’s view on tariffs is public opinion. In the past, retaliatory tariffs from China, the EU and others have targeted specific products from those districts in the U.S. with strong political influence on the administration. A severe market reaction could also impact the president’s decisions, although Trump has previously demonstrated he is comfortable with short-term market pain to achieve his goals.
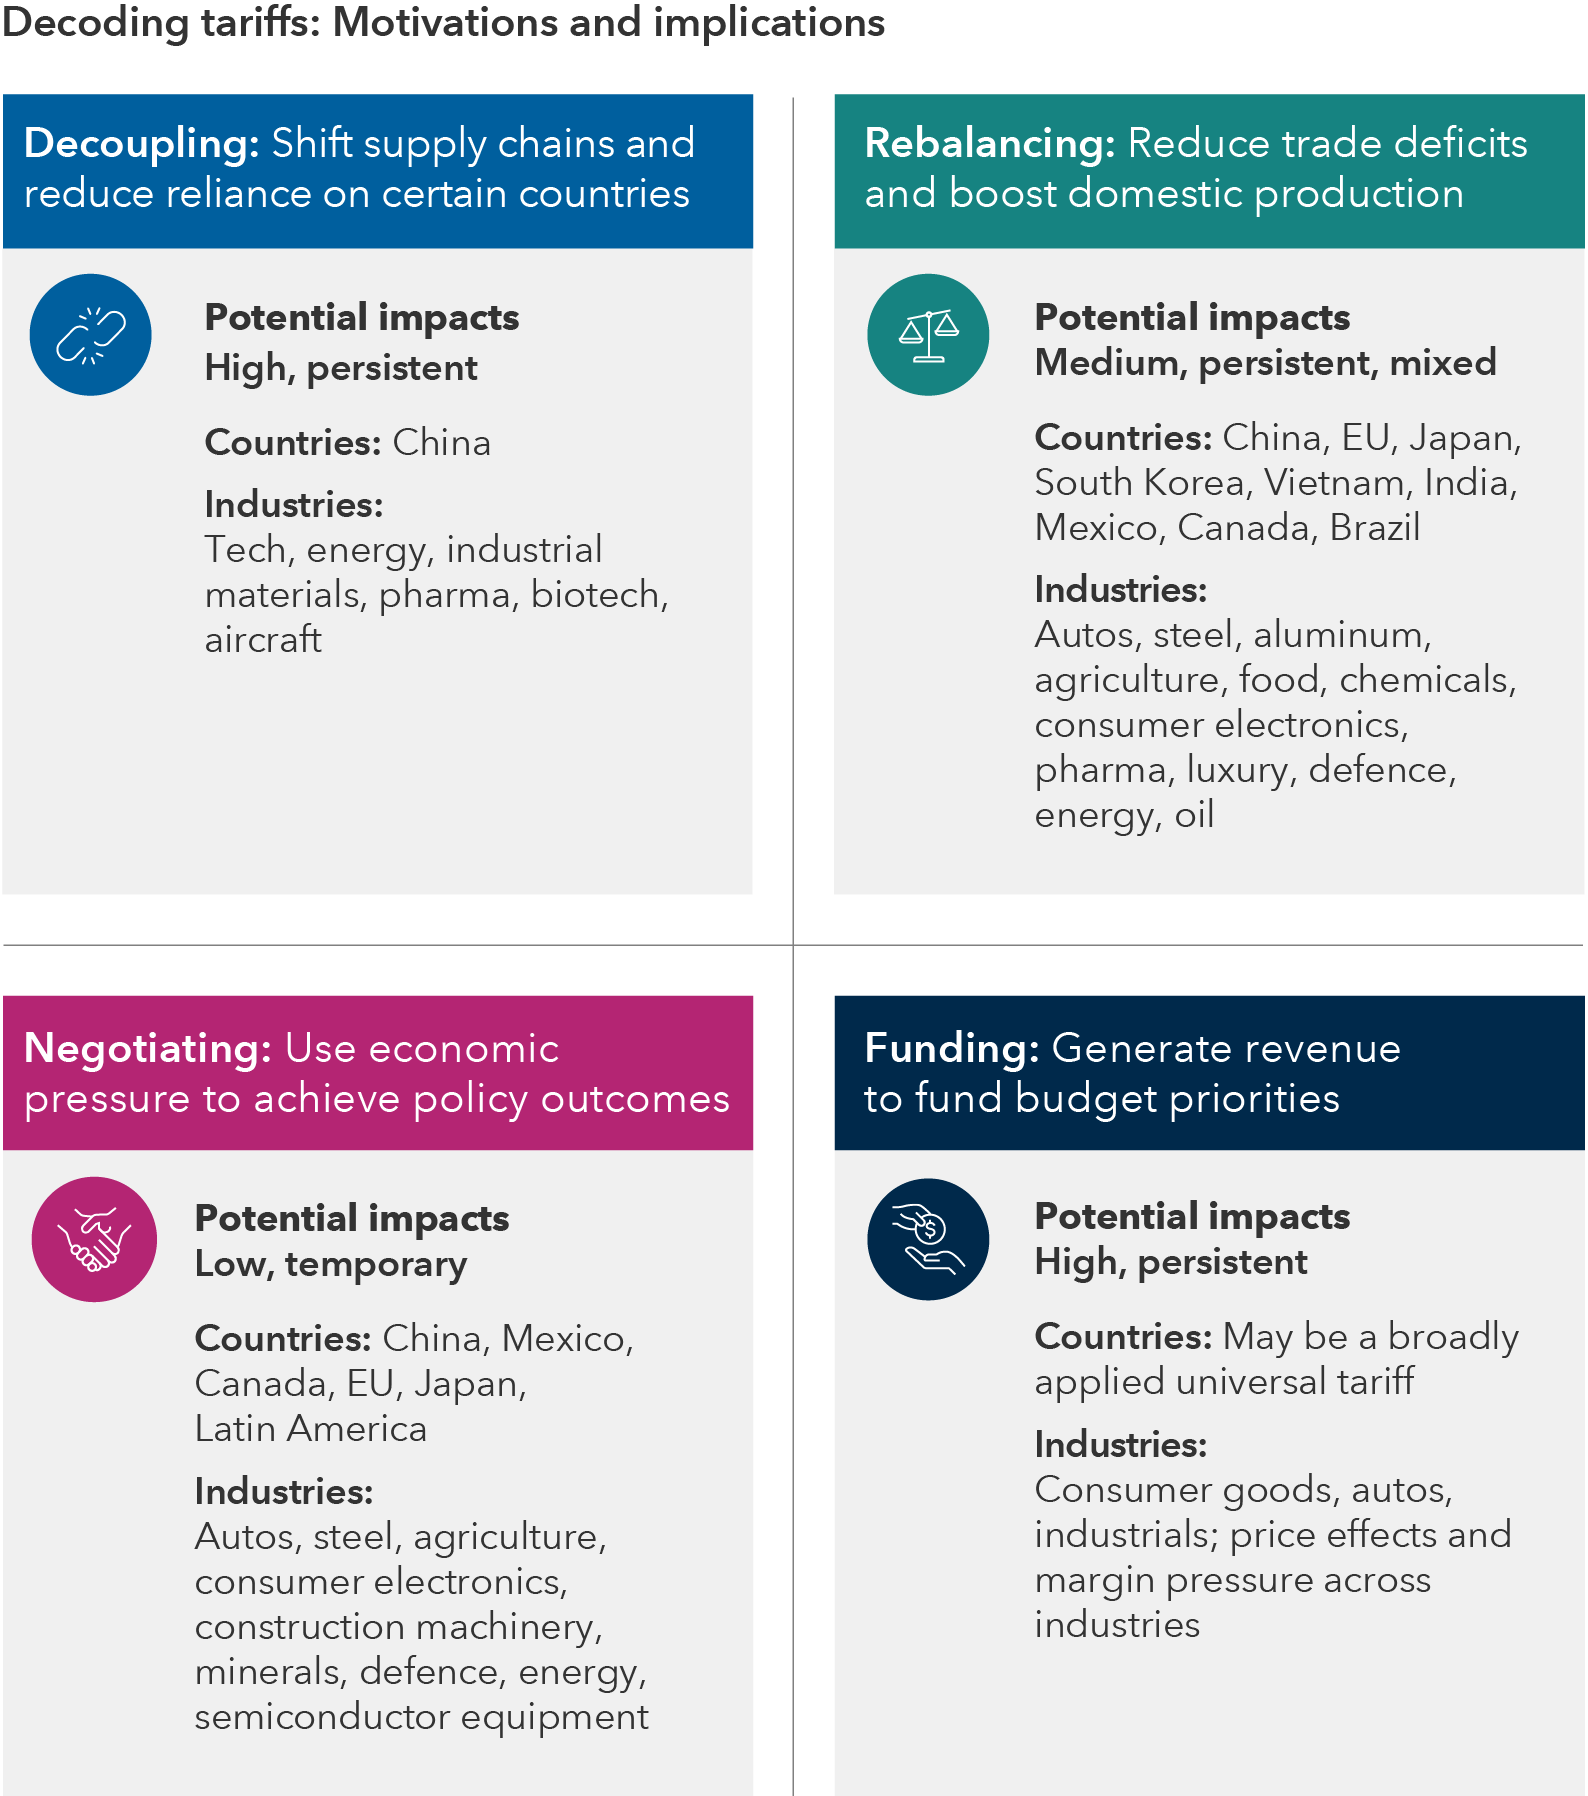
5. What will be the impact on regions and sectors globally?
Source: Capital Group as of April 2, 2025
Source: Capital Group as of April 2, 2025
Assessing what's next
Altogether, we expect an ongoing process, with recalibrations to many of the enacted tariffs. Initially, we may see higher tariffs in the near term, though lower in the long run, depending on the industry or national domicile. Fortunately for corporate firms, many have a healthy financial position with historically high margins. Some companies will experience a rise in input costs, though the severity of such increases remain in flux.
Under a scenario where tariffs are lasting and severe, such input costs could rise to a level that causes firms to cut capital expenditure, reduce head count or even cause a recession. Retaliatory tariffs are a key risk we’re eyeing. Lastly, if the proposed tariffs persist, we could see a downgrade of earnings estimates now that the initial rates are more punitive than expected.
Learn more about
Our latest insights
-
-
Market Volatility
-
Markets & Economy
-
Market Volatility
-
RELATED INSIGHTS
-
Chart in Focus
-
-
Emerging Markets
Commissions, trailing commissions, management fees and expenses all may be associated with investments in investment funds. Please read the prospectus before investing. Investment funds are not guaranteed or covered by the Canada Deposit Insurance Corporation or by any other government deposit insurer. For investment funds other than money market funds, their values change frequently. For money market funds, there can be no assurances that the fund will be able to maintain its net asset value per security at a constant amount or that the full amount of your investment in the fund will be returned to you. Past performance may not be repeated.
Unless otherwise indicated, the investment professionals featured do not manage Capital Group‘s Canadian investment funds.
References to particular companies or securities, if any, are included for informational or illustrative purposes only and should not be considered as an endorsement by Capital Group. Views expressed regarding a particular company, security, industry or market sector should not be considered an indication of trading intent of any investment funds or current holdings of any investment funds. These views should not be considered as investment advice nor should they be considered a recommendation to buy or sell.
Statements attributed to an individual represent the opinions of that individual as of the date published and do not necessarily reflect the opinions of Capital Group or its affiliates. This information is intended to highlight issues and not be comprehensive or to provide advice. For informational purposes only; not intended to provide tax, legal or financial advice. Capital Group funds are available in Canada through registered dealers. For more information, please consult your financial and tax advisors for your individual situation.
Forward-looking statements are not guarantees of future performance, and actual events and results could differ materially from those expressed or implied in any forward-looking statements made herein. We encourage you to consider these and other factors carefully before making any investment decisions and we urge you to avoid placing undue reliance on forward-looking statements.
The S&P 500 Composite Index (“Index”) is a product of S&P Dow Jones Indices LLC and/or its affiliates and has been licensed for use by Capital Group. Copyright © 2025 S&P Dow Jones Indices LLC, a division of S&P Global, and/or its affiliates. All rights reserved. Redistribution or reproduction in whole or in part are prohibited without written permission of S&P Dow Jones Indices LLC.
FTSE source: London Stock Exchange Group plc and its group undertakings (collectively, the "LSE Group"). © LSE Group 2025. FTSE Russell is a trading name of certain of the LSE Group companies. "FTSE®" is a trade mark of the relevant LSE Group companies and is used by any other LSE Group company under licence. All rights in the FTSE Russell indices or data vest in the relevant LSE Group company which owns the index or the data. Neither LSE Group nor its licensors accept any liability for any errors or omissions in the indices or data and no party may rely on any indices or data contained in this communication. No further distribution of data from the LSE Group is permitted without the relevant LSE Group company's express written consent. The LSE Group does not promote, sponsor or endorse the content of this communication. The index is unmanaged and cannot be invested in directly.
BLOOMBERG® is a trademark and service mark of Bloomberg Finance L.P. and its affiliates (collectively “Bloomberg”). Bloomberg or Bloomberg’s licensors own all proprietary rights in the Bloomberg Indices. Neither Bloomberg nor Bloomberg’s licensors approves or endorses this material, or guarantees the accuracy or completeness of any information herein, or makes any warranty, express or implied, as to the results to be obtained therefrom and, to the maximum extent allowed by law, neither shall have any liability or responsibility for injury or damages arising in connection therewith.
MSCI does not approve, review or produce reports published on this site, makes no express or implied warranties or representations and is not liable whatsoever for any data represented. You may not redistribute MSCI data or use it as a basis for other indices or investment products.
Capital believes the software and information from FactSet to be reliable. However, Capital cannot be responsible for inaccuracies, incomplete information or updating of the information furnished by FactSet. The information provided in this report is meant to give you an approximate account of the fund/manager's characteristics for the specified date. This information is not indicative of future Capital investment decisions and is not used as part of our investment decision-making process.
Indices are unmanaged and cannot be invested in directly. Returns represent past performance, are not a guarantee of future performance, and are not indicative of any specific investment.
All Capital Group trademarks are owned by The Capital Group Companies, Inc. or an affiliated company in Canada, the U.S. and other countries. All other company names mentioned are the property of their respective companies.
Capital Group funds are offered in Canada by Capital International Asset Management (Canada), Inc., part of Capital Group, a global investment management firm originating in Los Angeles, California in 1931. Capital Group manages equity assets through three investment groups. These groups make investment and proxy voting decisions independently. Fixed income investment professionals provide fixed income research and investment management across the Capital organization; however, for securities with equity characteristics, they act solely on behalf of one of the three equity investment groups.
The Capital Group funds offered on this website are available only to Canadian residents.