Market Volatility
Categories
Markets & Economy
Treasury market turmoil: How might the Fed react?
 Tom Reithinger
 Douglas Kletter
April 15, 2025
The U.S. Treasury market has come under pressure after President Donald Trump’s sweeping tariff announcements triggered a widespread sell-off in bonds. As policy decisions with deep financial implications are rapidly made and reversed, it is understandable that holders of U.S. assets might feel a sense of unease.
Two factors are at play in the U.S. Treasuries market: the large volume of investments by hedge funds and other investors in highly leveraged trades, as well as foreign investors potentially stepping away to diversify assets from the U.S. Some investors have grown concerned that this turmoil could be on the verge of creating a liquidity event, where Treasuries cannot be easily bought or sold without causing significant price changes. Should the market reach a breaking point like during the COVID-19 pandemic, we think the U.S. Federal Reserve will be quick to react, but probably not with rate cuts, given the uncertainty surrounding future inflation.
Treasury market has remained functional so far
Liquidity has tightened and uncertainty remains high, especially given the ability for individual headlines to cause a severe repricing. But so far, bond markets have mostly continued to function in an orderly fashion.
Market stability improved after the 90-day pause on reciprocal tariffs was announced April 9. In addition, the U.S. government was able to auction $39 billion (dollars in USD) of 10-year Treasuries on April 9 and $13 billion of 30-year Treasuries on April 10, with solid results. However, there is still some uncertainty in the market. Yields on 10-year Treasuries have risen to near 4.4%.
U.S. Treasury market breakdown
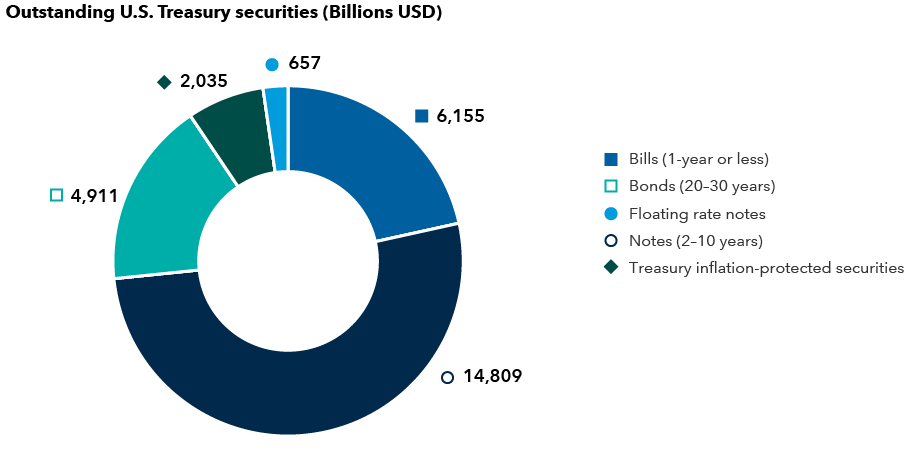
Source: U.S. Treasury. Data as of February 28, 2025.
How much influence do non-U.S. buyers have?
There has been significant attention on non-U.S. investors selling Treasuries. Data is sparse in rates markets, but we have not seen evidence of widespread divestment by non-U.S. investors to date. However, there are signs that international buyers could be eschewing Treasury auctions as they diversify their reserves into other currencies. At the same time we're seeing long-term yields rise, we are also seeing the U.S. dollar weaken.
If global investors are beginning to shun the U.S. Treasury market, it would be cause for concern, as it takes away a large buyer and could put more pressure on rates. But when we're talking about any one individual actor dumping assets, it's worth pointing out that the holders of Treasuries are a lot more dispersed than they were even 10 years ago.
Treasury ownership has grown more diversified

Source: U.S. Treasury. Data as of February 28, 2025.
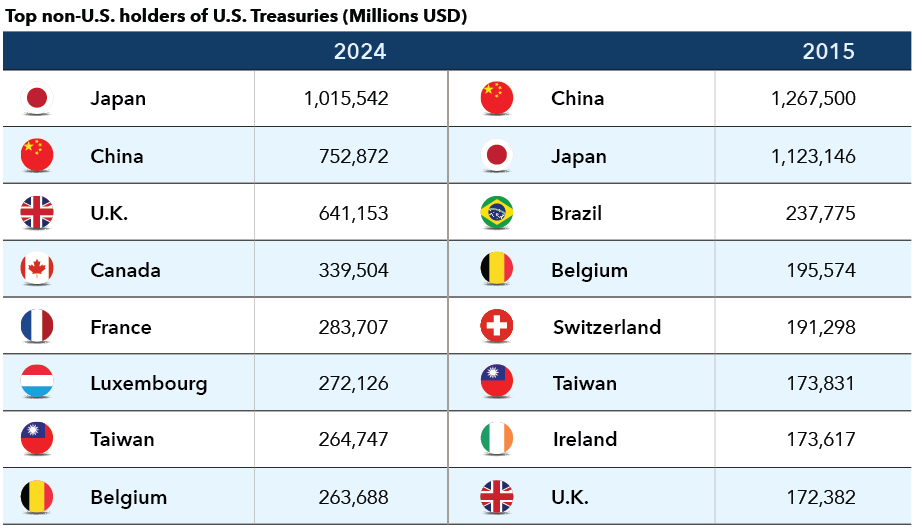
Source: U.S. Treasury. Data as of February 28, 2025.
What role are hedge funds playing?
The potential problems arising from hedge funds are varied and significant. Many market participants have singled out so-called “basis trades,” where investors buy a Treasury security and simultaneously sell a futures contract on that same security. These trades typically involve leverage, meaning investors borrow money to increase their positions. This can amplify gains but also losses. In aggregate, these trades represent around $800 billion in market value and serve the critical function of providing liquidity in the market. If many investors unwind their leveraged positions simultaneously, it could lead to a sudden and potentially severe liquidity shock, as we experienced in the COVID-19 pandemic. Other highly leveraged arbitrage trades, involving off-the-run issuances or swap spreads, have also been identified as potential contributors to the liquidity crunch.
What tools does the Fed have at its disposal?
In addition to its dual mandate of full employment and stable prices, the Fed also seeks to ensure market stability. We think that the Fed will be quick to interject if they deem the market is acting dysfunctionally or if there is something broken in the intermediation process. Susan Collins, head of the Federal Reserve Bank of Boston, reinforced this view on Friday, April 11, telling the Financial Times the central bank would “absolutely be prepared (to) address concerns about market functioning or liquidity, should they arise.”
Broad monetary policy tools like rate cuts or quantitative easing seem unlikely. Tariffs put the Fed in a difficult position. Their choice is between holding policy to fight inflation and risking a recession, or easing policy and risking inflation getting out of hand. We anticipate the Fed will emphasize inflation because unemployment is not an issue at this point, and we believe the Fed does not want to be seen as doing the bidding of the Trump administration. But the central bank has other ways of helping stabilize markets that have proven to be very effective historically. Some examples include:
- Repo operations: The Fed has used repo operations (short-term borrowing and lending transactions where securities are sold with an agreement to repurchase them at a later date) to manage short-term interest rates and provide liquidity. In 2019, the Fed stepped in to address a repo market blowout with $100 billion per day of overnight swaps and $60 billion per day of 14-day swaps.
- Standing repo facility: After the 2019 repo crisis, the Fed implemented a permanent facility to act as a ceiling on repo rates and provide liquidity to the financial system by allowing banks to borrow against their securities holdings.
- Temporary or permanent asset purchases: These are interventions, where the central bank buys assets to provide liquidity and stabilize the market. One example of this is when the Bank of England implemented a temporary program in 2022 to address a spike in gilt yields.
- Operation Twist: A $400 billion program used by the Fed in 2011 to support long duration U.S. Treasuries by selling short-dated instruments while keeping its balance sheet unchanged in size.
These sorts of programs can be quickly implemented. Other potential actions could include accelerating the end of quantitative tightening or loosening regulations to allow banks to hold more securities on their balance sheets. The Treasury also has a large degree of control over the debt management process. We still expect the status quo for bond auctions this year, but there is the potential to shift the supply mix to support certain parts of the curve.
However, these sorts of measures cannot address the lingering concern that political overreach may have reduced structural demand for Treasuries (similar to what happened in the U.K. when former Prime Minister Liz Truss announced a mini-budget calling for massive tax cuts in 2022). If this is indeed happening, it is not something the Fed will likely be able to fix over the long term.
Potential economic impact
Economic momentum is likely to soften, as tariffs pose a significant risk to consumer spending, which accounts for nearly 70% of U.S. GDP. They reduce purchasing power, given their inflationary effects, potentially lowering demand for goods and services. Even if tariffs are not fully passed onto consumers or are negotiated down from initial levels, their broader economic impact could heighten downside risks, especially if they provoke retaliation that reduces exports.
As such, recession risks appear to be rising, even as inflationary pressures are likely building. Our fixed income portfolio managers have generally been defensively positioned, in the context of their respective opportunity sets, through up-in-quality credit postures and rates positions designed to preserve portfolios in a risk-off scenario. We on the rates team believe the market’s fear over U.S. safe haven status is likely overblown. Duration appears more compelling now, given heightened downside risks. U.S. yields have gone higher despite a worrisome growth trajectory and look attractive on an inflation-adjusted basis compared to other developed markets.
Curve steepeners have benefitted from increased term premium and as a recession hedge. Importantly, the yield curve could steepen in multiple scenarios: 1) The Fed cuts into a growth shock even with higher inflationary pressures, or 2) Higher deficit and Treasury supply concerns, particularly if countercyclical spending measures are triggered, push yields higher on the long end, even if the Fed doesn’t cut.
Learn more about
Thomas Reithinger is a portfolio manager for Capital Group Canadian Core Plus Fixed Income Fund (Canada) and Capital Group World Bond Fund (Canada).
Duration – A measure of a bond’s sensitivity to changes in interest rates. Generally speaking, a bond's price will go up 1% for every year of duration if interest rates fall by 1% or down 1% for every year of duration if interest rates rise by 1%.
Yield curve – The difference in bond yields (interest rates) of equal credit quality but differing maturity dates.
Curve steepener – A portfolio position that is designed to gain when the gap between short- and long-term yields grows.
Term premium – Compensation that investors require for bearing the risk that interest rates may change.
Off-the-run – Refers to U.S. Treasuries that are not the most recently issued. Some arbitrage trades attempt to capitalize on pricing differences between these securities and the most recent (on-the-run) Treasury issuances.
Swap spreads – The difference between the yield on a swap contract and the yield on a government bond of the same maturity.
Our latest insights
-
-
Market Volatility
-
-
Market Volatility
-
RELATED INSIGHTS
Commissions, trailing commissions, management fees and expenses all may be associated with investments in investment funds. Please read the prospectus before investing. Investment funds are not guaranteed or covered by the Canada Deposit Insurance Corporation or by any other government deposit insurer. For investment funds other than money market funds, their values change frequently. For money market funds, there can be no assurances that the fund will be able to maintain its net asset value per security at a constant amount or that the full amount of your investment in the fund will be returned to you. Past performance may not be repeated.
Unless otherwise indicated, the investment professionals featured do not manage Capital Group‘s Canadian investment funds.
References to particular companies or securities, if any, are included for informational or illustrative purposes only and should not be considered as an endorsement by Capital Group. Views expressed regarding a particular company, security, industry or market sector should not be considered an indication of trading intent of any investment funds or current holdings of any investment funds. These views should not be considered as investment advice nor should they be considered a recommendation to buy or sell.
Statements attributed to an individual represent the opinions of that individual as of the date published and do not necessarily reflect the opinions of Capital Group or its affiliates. This information is intended to highlight issues and not be comprehensive or to provide advice. For informational purposes only; not intended to provide tax, legal or financial advice. Capital Group funds are available in Canada through registered dealers. For more information, please consult your financial and tax advisors for your individual situation.
Forward-looking statements are not guarantees of future performance, and actual events and results could differ materially from those expressed or implied in any forward-looking statements made herein. We encourage you to consider these and other factors carefully before making any investment decisions and we urge you to avoid placing undue reliance on forward-looking statements.
The S&P 500 Composite Index (“Index”) is a product of S&P Dow Jones Indices LLC and/or its affiliates and has been licensed for use by Capital Group. Copyright © 2025 S&P Dow Jones Indices LLC, a division of S&P Global, and/or its affiliates. All rights reserved. Redistribution or reproduction in whole or in part are prohibited without written permission of S&P Dow Jones Indices LLC.
FTSE source: London Stock Exchange Group plc and its group undertakings (collectively, the "LSE Group"). © LSE Group 2025. FTSE Russell is a trading name of certain of the LSE Group companies. "FTSE®" is a trade mark of the relevant LSE Group companies and is used by any other LSE Group company under licence. All rights in the FTSE Russell indices or data vest in the relevant LSE Group company which owns the index or the data. Neither LSE Group nor its licensors accept any liability for any errors or omissions in the indices or data and no party may rely on any indices or data contained in this communication. No further distribution of data from the LSE Group is permitted without the relevant LSE Group company's express written consent. The LSE Group does not promote, sponsor or endorse the content of this communication. The index is unmanaged and cannot be invested in directly.
BLOOMBERG® is a trademark and service mark of Bloomberg Finance L.P. and its affiliates (collectively “Bloomberg”). Bloomberg or Bloomberg’s licensors own all proprietary rights in the Bloomberg Indices. Neither Bloomberg nor Bloomberg’s licensors approves or endorses this material, or guarantees the accuracy or completeness of any information herein, or makes any warranty, express or implied, as to the results to be obtained therefrom and, to the maximum extent allowed by law, neither shall have any liability or responsibility for injury or damages arising in connection therewith.
MSCI does not approve, review or produce reports published on this site, makes no express or implied warranties or representations and is not liable whatsoever for any data represented. You may not redistribute MSCI data or use it as a basis for other indices or investment products.
Capital believes the software and information from FactSet to be reliable. However, Capital cannot be responsible for inaccuracies, incomplete information or updating of the information furnished by FactSet. The information provided in this report is meant to give you an approximate account of the fund/manager's characteristics for the specified date. This information is not indicative of future Capital investment decisions and is not used as part of our investment decision-making process.
Indices are unmanaged and cannot be invested in directly. Returns represent past performance, are not a guarantee of future performance, and are not indicative of any specific investment.
All Capital Group trademarks are owned by The Capital Group Companies, Inc. or an affiliated company in Canada, the U.S. and other countries. All other company names mentioned are the property of their respective companies.
Capital Group funds are offered in Canada by Capital International Asset Management (Canada), Inc., part of Capital Group, a global investment management firm originating in Los Angeles, California in 1931. Capital Group manages equity assets through three investment groups. These groups make investment and proxy voting decisions independently. Fixed income investment professionals provide fixed income research and investment management across the Capital organization; however, for securities with equity characteristics, they act solely on behalf of one of the three equity investment groups.
The Capital Group funds offered on this website are available only to Canadian residents.