Market Volatility
Categories
Emerging Markets
Emerging markets debt outlook for 2025
 Robert Burgess
 Harry Phinney
January 15, 2025
KEY TAKEAWAYS
- The global backdrop is favourable with resilient U.S. growth combined with U.S. Federal Reserve (Fed) easing, but President-elect Donald Trump is likely to introduce volatility and tail risks into emerging markets (EM) in 2025.
- Fundamentals are generally positive so EMs should be in a good position to deal with what comes their way.
The overall global macroeconomic outlook was favourable for risk assets in 2024. Despite recession concerns at the start of the year, U.S. growth has remained strong, while the Fed began reducing interest rates from above-neutral levels as inflation continued to decelerate. China, meanwhile, began to cautiously implement measures to boost domestic demand. While China‘s economic situation appears less stable than that of the U.S., the government has further fiscal ammunition at its disposal. Finally, energy prices declined, which provided a significant boost for some of the largest EM economies, such as China and India.
Looking ahead to 2025, the macro environment sets the stage for a friendly backdrop in EM, especially given widespread disinflation, which should allow most major central banks to significantly ease rates throughout 2025. However, the incoming U.S. administration poses a number of risks to EMs. Trump has made four key economic policy proposals: increasing tariffs (up to 60% on China and 10% on the rest of the world), reducing or reversing immigration, decreasing taxes (an extension of the 2017 tax cuts and a reduction in corporate tax likely), and reducing regulation (mainly in energy and financial industries).
These policies present potential headwinds to EMs. That said, actual policy actions might not be as draconian as proposed during the campaign, especially on tariffs. During Trump‘s first term in 2016, for example, the focus was initially on fiscal rather than trade policy, and if this were to be the case again, it could be more positive than negative for certain EMs. Meanwhile, in the Middle East, both de-escalation and escalation scenarios are possible under the new Trump administration. A Trump administration is likely to present predominantly bearish risks for oil prices due to trade policies and oil and gas regulations but sanctions on Iran pose upward risks.
Factoring in this uncertainty, we aim to explore Trump’s key policy priorities within this framework of factors most likely to affect EM debt markets: (1) the level of interest rates (Fed rates for dollar debt, local rates for local currency debt); (2) the value of the exchange rate and (3) fundamentals within EM.
Global and local interest rates
Expansionary U.S. fiscal policy and tariffs could both put upward pressure on U.S. inflation. Reducing taxes without a reduction in expenditure boosts overall demand in the economy, which will generally raise prices (unless supply also increases) and can also lead to higher wages. Tariffs, meanwhile, directly lead to a rise in domestic inflation in the U.S. by raising the cost of imported goods. These tariffs may also reduce foreign competition, giving domestic producers more runway to raise prices themselves, exacerbating inflation pressures. Whether this translates into sustained inflation depends on the U.S. Federal Reserve’s (Fed) response to this price level shock.
In the case of a hawkish Fed, this might put pressure on some EM central banks to maintain higher interest rates domestically.
Most EM central banks are still expected to cut rates
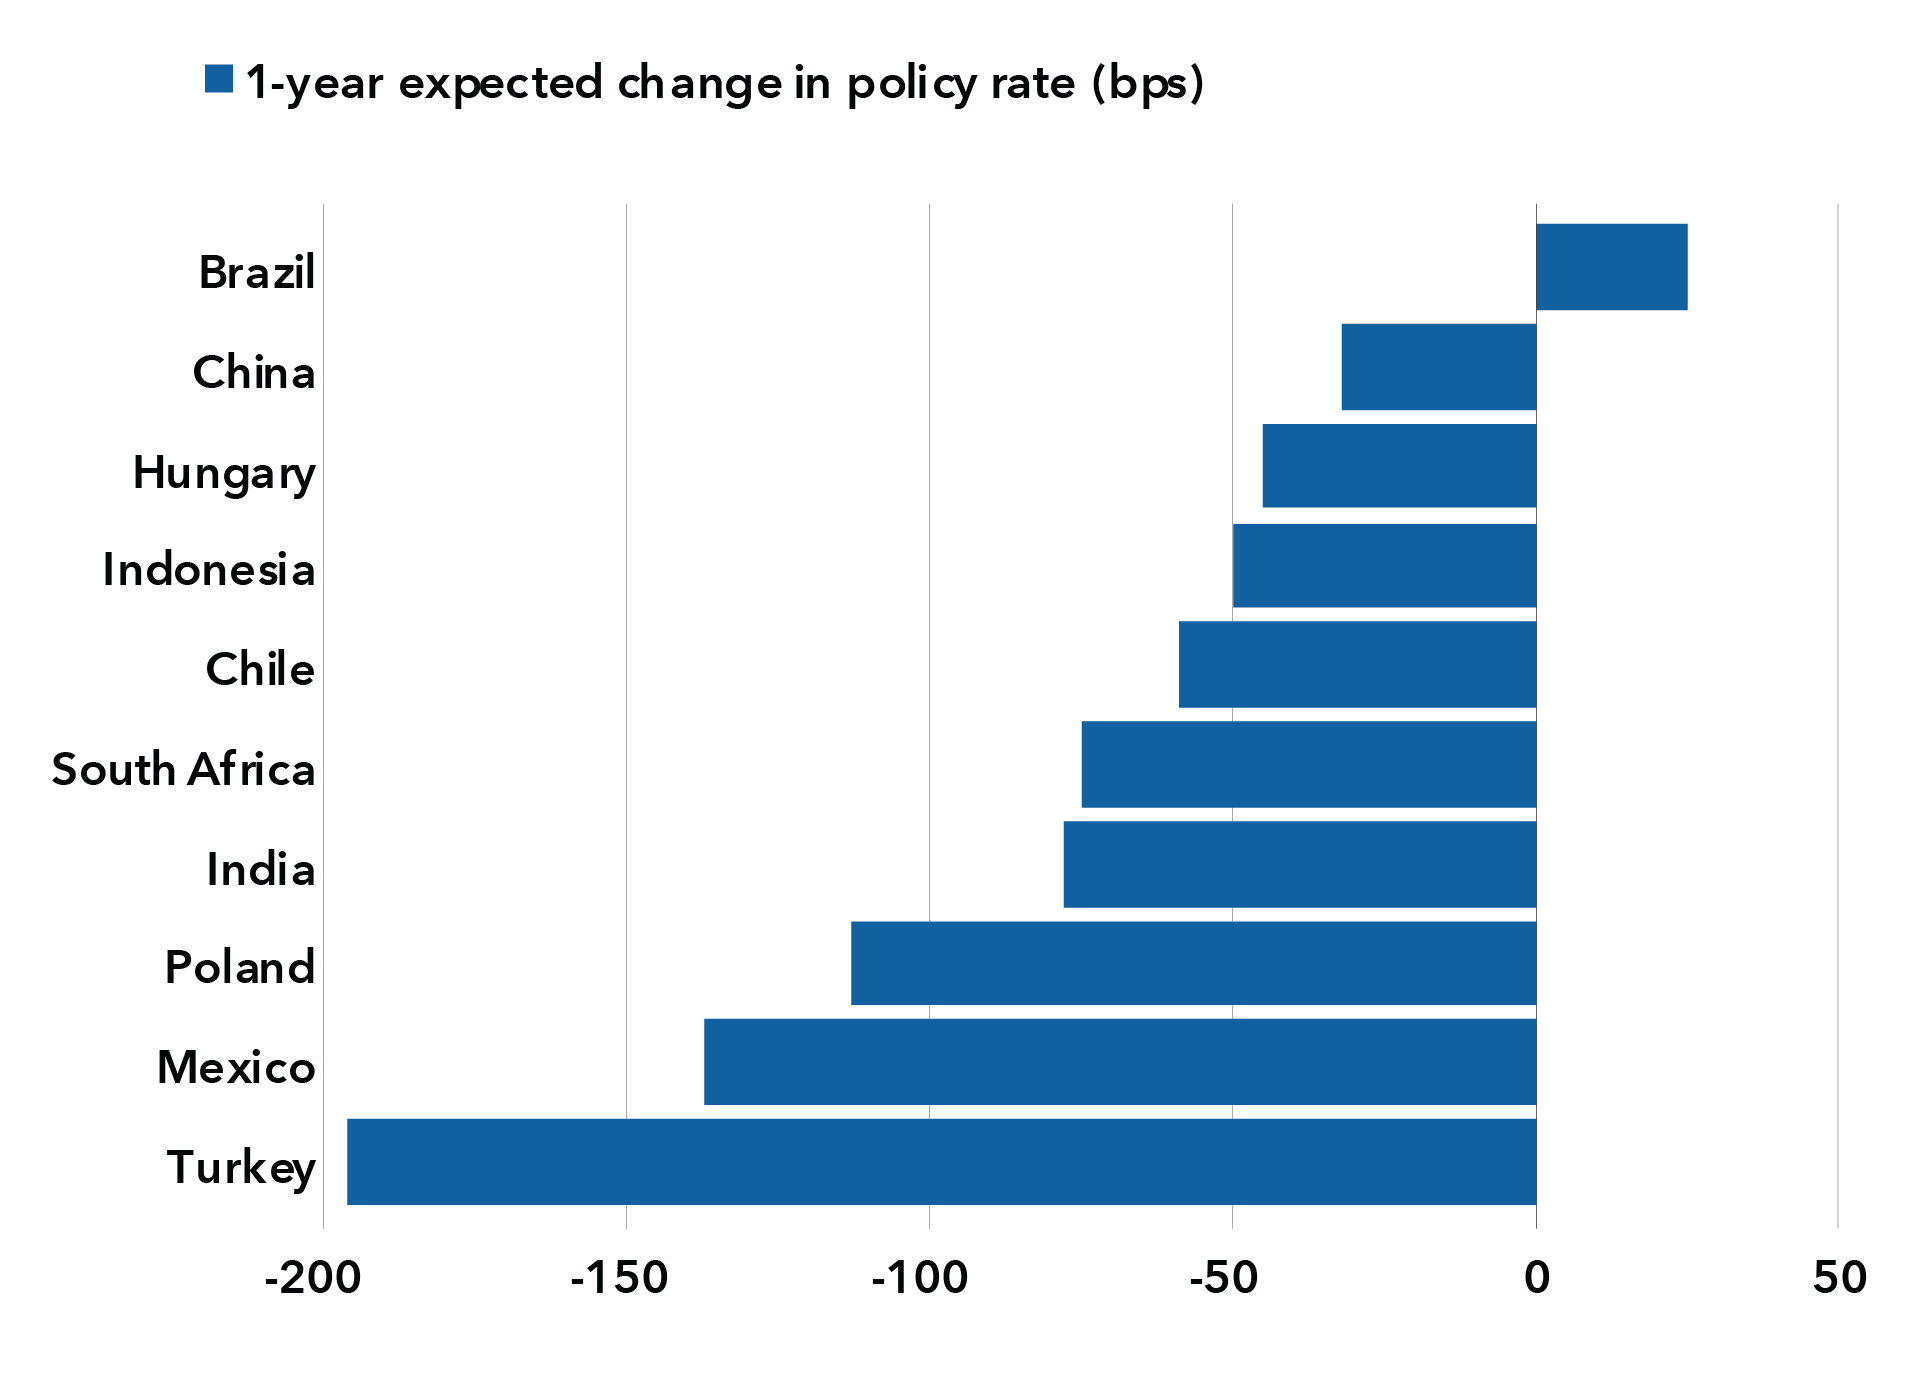
Sources: Bloomberg, Goldman Sachs. As of December 2, 2024.
These risks are highest in EM countries with greater vulnerabilities, particularly those with high or persistent inflation and low external stability. Central banks in these countries might cut rates less or even hike them, depending on the extent of exchange rate movements. Brazil, for example, has already been forced to start hiking rates in response to currency weakness and market concerns about its fiscal position. In the fundamentally stronger EM countries, including many in Asia, central banks have become more confident in moving ahead of the Fed due to the absence of systemic pressure on financial systems and with the development of deeper and more liquid local markets. These central banks may prioritize mitigating the growth impact of tariffs by embracing exchange rate weakness and implementing rate cuts. This is more likely to be the case if China ends up exporting deflation in a bid to export elsewhere. One important takeaway from 2018-2019 is that tariffs had minimal effect on EM inflation.
The dollar and EM currencies
The U.S. dollar should strengthen, at least initially, should the U.S. impose additional tariffs and fiscal policy become more expansionary. Tariffs tend to reduce U.S. demand for imported goods due to their rising cost, directly shrinking demand for those foreign currencies, which will likely weaken. Moreover, this impact tends to grow as consumers have more time to find substitutes and adjust their consumption habits. Over the longer term, however, tariffs might reduce growth prospects in the U.S., which would tend to weaken the dollar. Similarly, an expansionary fiscal policy agenda could increase U.S. growth expectations and attract capital flows into the U.S., thereby boosting the dollar, but in the long term, a higher U.S. debt-to-gross domestic product (GDP) ratio could pressure the U.S. dollar the other way. Note that a more erratic and unpredictable economic policy will likely have opposing effects on the dollar. For example, Trump has remarked publicly that the U.S. has a “big currency problem” and that the dollar’s strength has harmed American competitiveness.
A shift in trade patterns following the first round of Trump tariffs
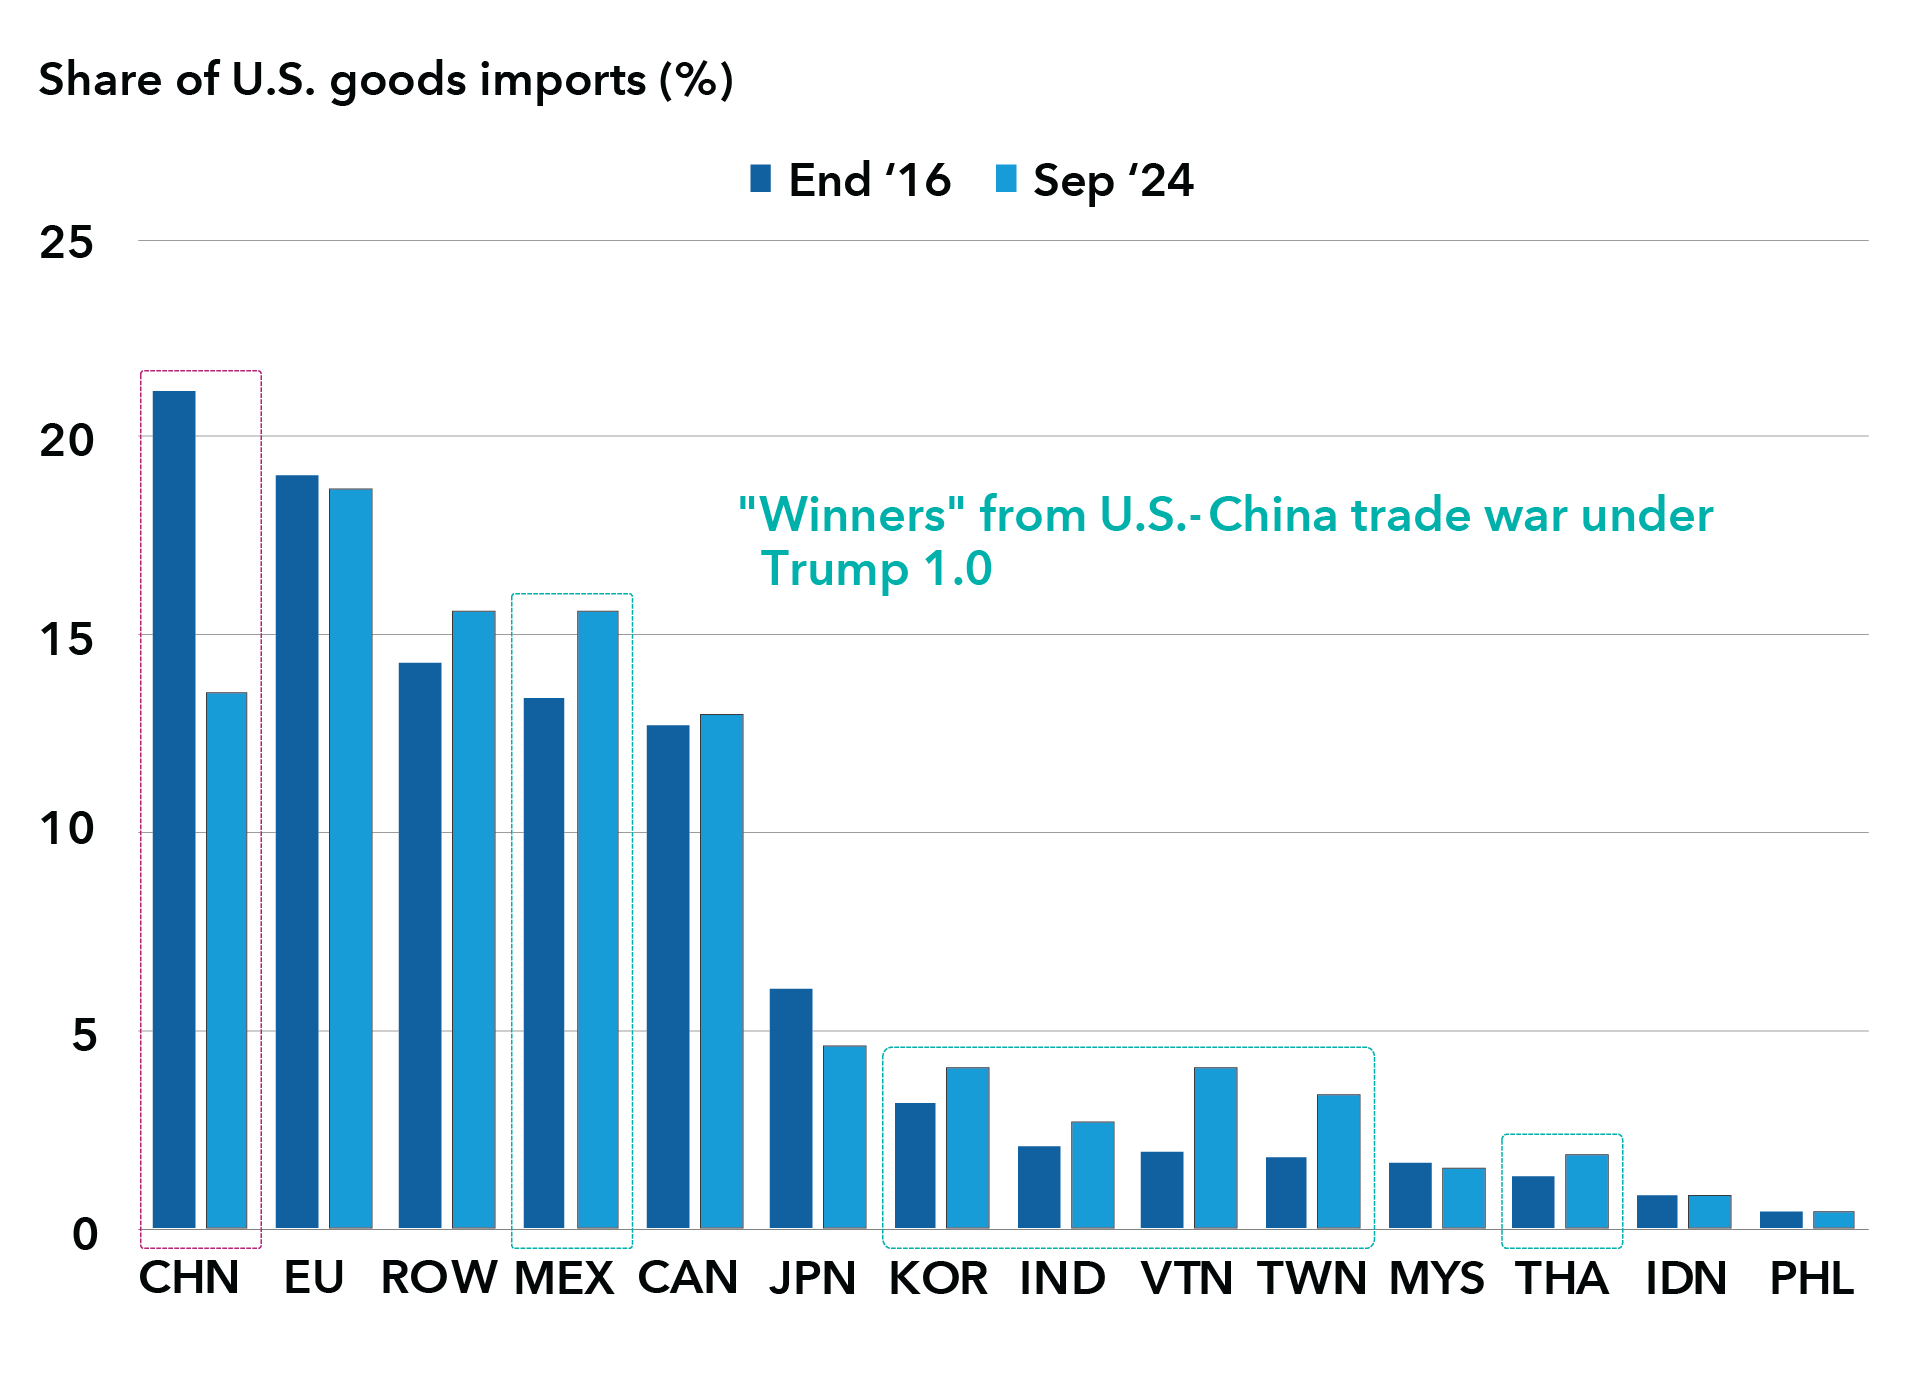
As of October 2024. Source: U.S. Census Bureau.
The impact of tariffs would also likely vary by country. During the first Trump administration, the most material increases in U.S. tariffs were on China. While this led to a significant reduction in the share of U.S. imports that were directly sourced from China, the diversion of trade flows away from China benefited some countries, notably Mexico and Vietnam, which saw their share of U.S. imports increase. Similarly, some countries such as Brazil were able to gain market share in China after it imposed retaliatory tariffs, targeted mainly on agricultural products, on imports from the U.S. Whether or not we see the same pattern under a second administration would depend on if China is again the primary focus of new tariffs, or if the tariffs are applied more broadly, including to other countries with which the U.S. is running significant bilateral trade deficits, such as Mexico and Vietnam. Mexico is also vulnerable to how U.S. policy may change on immigration issues. Any negative effects on remittances would harm growth, the current account balance, and thus the currency.
EM fundamentals
EMs have proven resilient since the previous Trump presidency, enduring two regional wars and a pandemic. External balances are generally strong outside of some frontier markets, while inflation has moderated substantially from 2022 peaks and is generally on a downward trend amid continued restrictive monetary policy stances. Fiscal indicators are generally the weak spots, but most of the major EMs have lengthened the maturity profile of their debt and are issuing more debt now in local currency. Many EM countries also have room to ease rates and support growth if needed. China might deliver more fiscal easing, offsetting some of the headwinds from higher tariffs.
EM external positions look relatively healthy
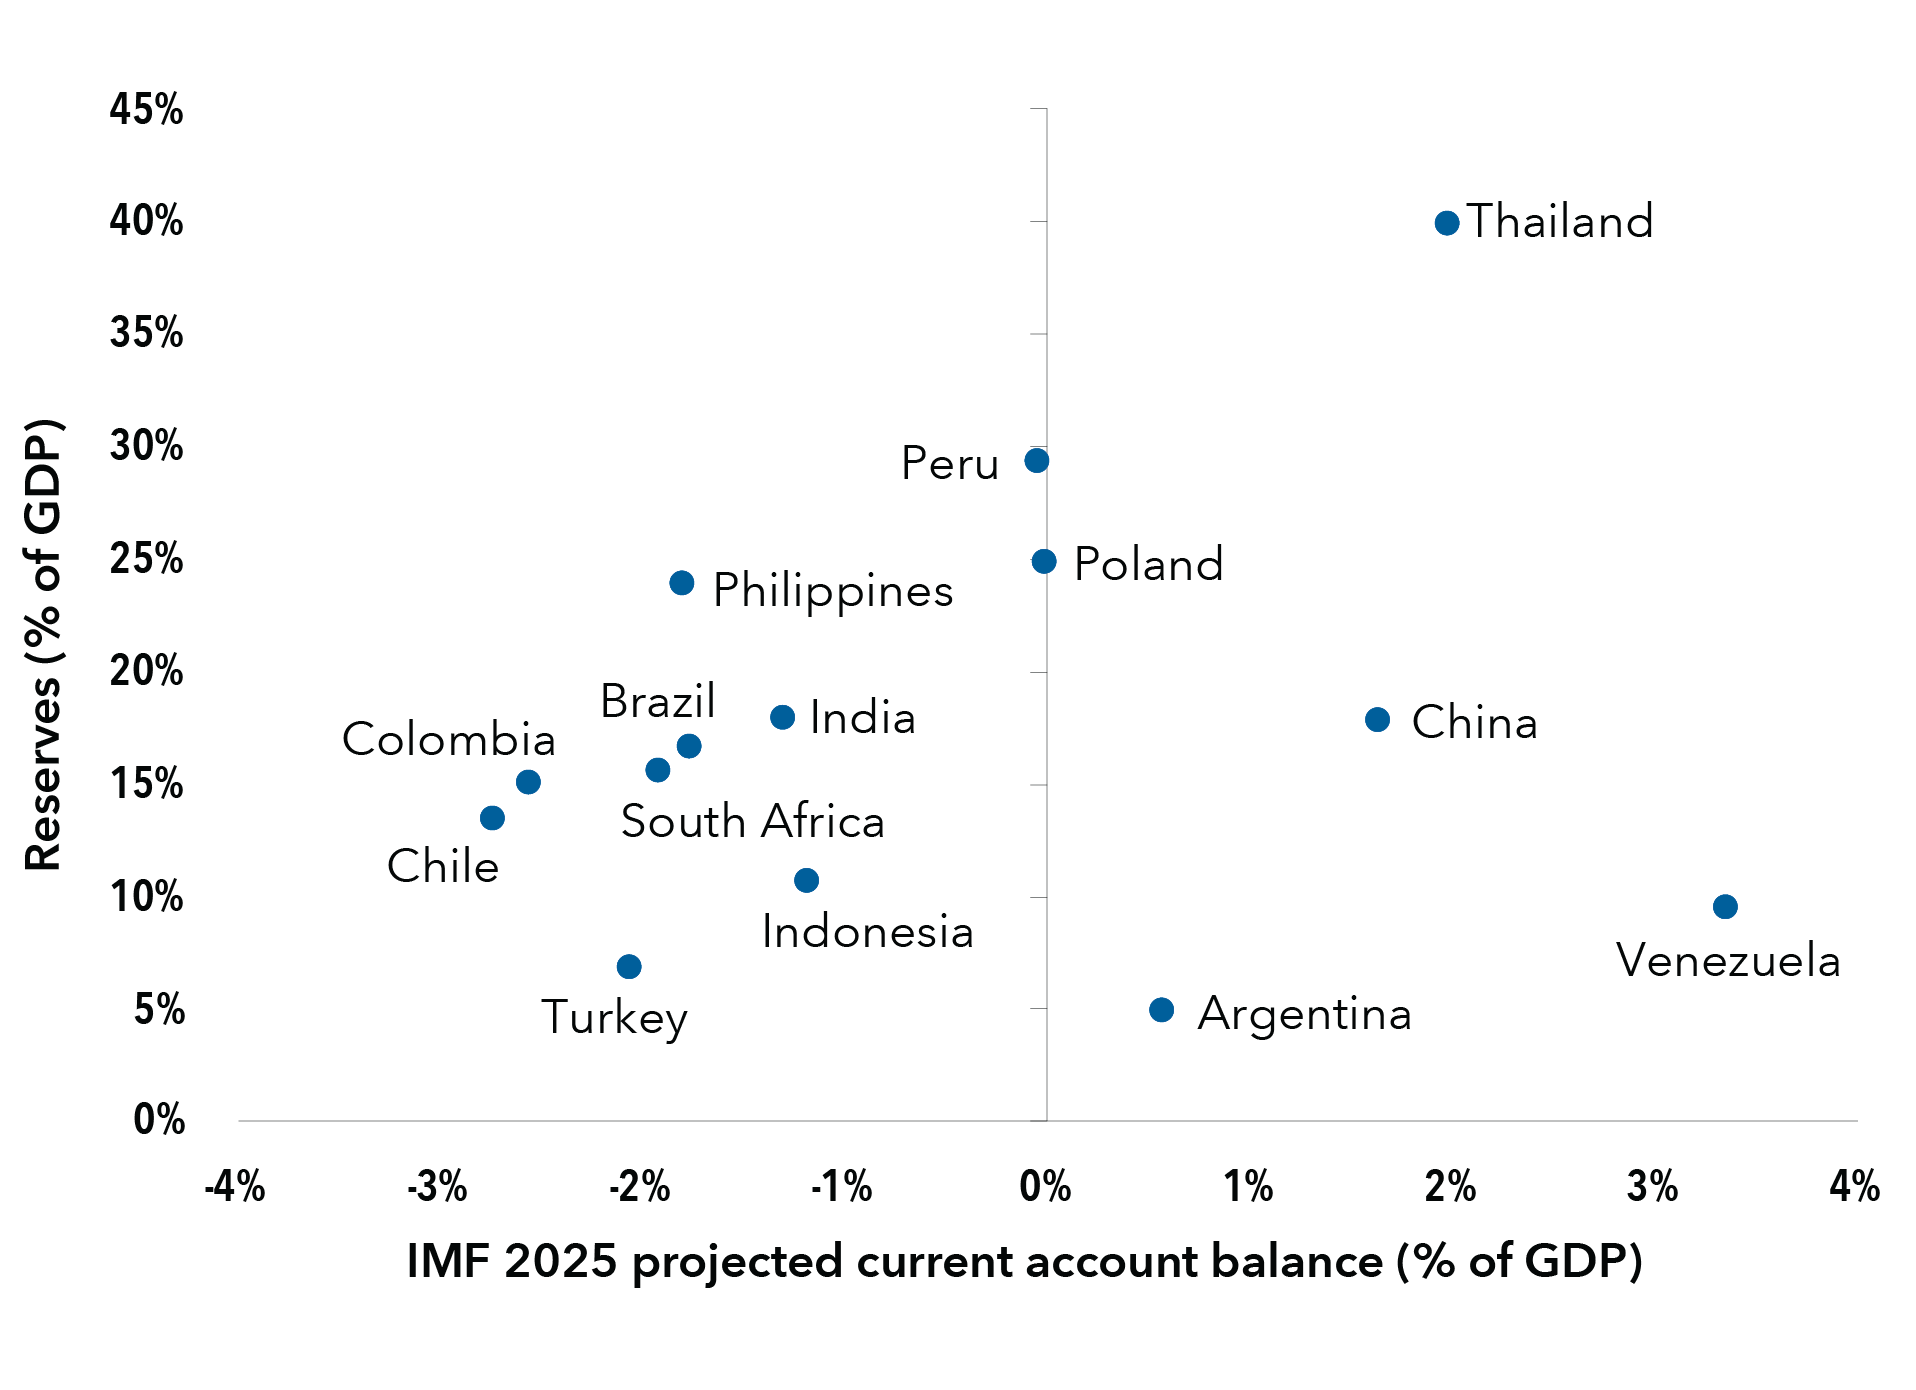
Source: International Monetary Fund, World Economic Outlook Database, October 2024.
Similarly, EM corporate fundamentals appear to be in good shape, especially when compared to developed market corporates. As a result of enduring the pandemic relatively effectively, they are generally in a better position than they have been for most of the past decade. The high default rates observed in EM corporates in recent years were primarily concentrated in specific areas, such as the Chinese property sector and companies affected by the Russia/Ukraine war.
Investing in this environment
In local EM markets, valuations remain fairly attractive as many EM central banks were quick to hike when inflationary pressures began to build in 2022-2023 but have been more cautious in cutting rates as these pressures have dissipated. This means that many countries have room to ease policy to support growth if needed and as long as inflation remains under control.
In hard currency sovereign markets, solid macro fundamentals in EM economies but mixed valuations require greater selectivity. EMs with lower external vulnerabilities and smaller internal imbalances offer greater market resilience and more flexibility for policymakers to address external risks, although spreads are generally fairly tight in these higher rated economies.
In EM corporate credit, fundamentals look to be in better shape as EM corporate treasurers have for the most part taken a more prudent approach to borrowing. The geographic representation and risk structure of EM corporates is quite different from sovereigns, providing an element of diversification. Shorter dated investment-grade bonds inside the corporate world have proved quite resilient during times of volatility in the past and can help with defensive positioning.
Regional views
Latin America
While Latin America is more tied to the U.S. economic cycle than other regions, it may be less vulnerable to a further escalation in tariffs. With the exception of Mexico, the U.S. generally already runs bilateral trade surpluses with the larger economies in the region, which are also primarily commodity exporters, making them a less obvious target for tariffs. Mexico, however, could experience negative impacts due to the uncertainty surrounding the 2026 United States- Mexico-Canada Agreement (USMCA) review, especially concerning Chinese foreign direct investment (FDI) and the import content in Mexico‘s exports, but stronger U.S. growth and nearshoring may well offset these effects.
Fundamentals look relatively strong within the region with decent growth, healthy external balances, and moderate and falling inflation, although fiscal concerns have grown. This uncertainty around fiscal policy (and some political issues) has led to a sizeable repricing in local markets rates, particularly in Brazil and Mexico – well before the U.S. election in November. We see local market opportunities within both countries, particularly in Brazil where local yields remain at high levels.
We also see opportunities within the hard currency space within Latin America, particularly within Colombia and Honduras. Both countries have dynamic economies with high GDP growth between 3-4%, are reducing COVID-19-era fiscal deficits via robust fiscal rules and an International Monetary Fund (IMF) program, respectively, and offer attractive spreads relative to other sovereign peers.
Asia
Asia is potentially more vulnerable to further tariffs, both directly and indirectly through global supply chains. The U.S.-China trade war of 2018 resulted in slower Chinese economic growth and a sharp currency depreciation, but it is important to note that China now has lower direct exposure to the U.S. and has tools at its disposal to counteract any tariff-induced growth/export shock. So, despite the threat of 60% tariffs, the impact this time around may not necessarily be as significant.
Outside of China, universal tariffs are likely to affect the more open economies (Taiwan, Korea, Singapore), compared to the more domestically-focused economies of India, Indonesia and the Philippines. The macroeconomic outlook also looks positive for EM Asia ex-China. Activity is broadening out due to exports and better inflation-adjusted household income, while low inflation remains well-entrenched. Fiscal balances are generally in decent shape, except for India, but even here, the large deficits are mitigated by local funding and a multiyear tightening trend. We see local duration opportunities in India and Indonesia, given the returns outlook (high real yields and a likely monetary easing path).
Central & Eastern Europe, Middle East, and Africa (CEEMEA)
While EM Europe has relatively limited direct trade with the U.S., it may nevertheless be impacted by tariffs if the U.S. targets its large bilateral trade deficit with the EU. Higher EU tariffs on China are a further risk given the integration of some EM European economies into the Chinese automotive supply chain.
In central Europe, we prefer local markets with a positive balance of payments backdrop such as Poland, which has well diversified export markets and is working its way up the value chain, factors that should be supportive for its currency. We also see opportunities in Romanian hard currency bonds: while its large fiscal deficit is adding to external funding pressures, we think spreads are already at attractive levels that compensate for these risks. Fundamentally, Romania also has an amicable relationship with the EU, and we are inclined to look through recent election-related noise, which has added to pressure on spreads.
Turkey is another area of value in the local currency space, in our opinion, given high rates, expected disinflation, relatively low foreign investor positioning and a sharply improved central bank FX position.
Within Africa, the combination of a stronger dollar and still relatively elevated U.S. interest rates could weigh on countries with large external imbalances and financing needs, such as Kenya and Senegal. Softer oil prices would represent a headwind for Angola, Gabon and Nigeria, although Angola at least has demonstrated good capacity to adjust to prior oil price downturns. We like duration in South Africa where real rates are near the upper end of historical ranges after a sharp rate hiking cycle with the central bank only starting the rate cutting cycle in September. The move to a coalition government following elections in May should facilitate further fiscal consolidation and structural reforms, providing a further backstop to South African risk.
Learn more about
Our latest insights
-
-
Market Volatility
-
Markets & Economy
-
-
Market Volatility
RELATED INSIGHTS
-
-
Chart in Focus
-
U.S. Equities
Commissions, trailing commissions, management fees and expenses all may be associated with investments in investment funds. Please read the prospectus before investing. Investment funds are not guaranteed or covered by the Canada Deposit Insurance Corporation or by any other government deposit insurer. For investment funds other than money market funds, their values change frequently. For money market funds, there can be no assurances that the fund will be able to maintain its net asset value per security at a constant amount or that the full amount of your investment in the fund will be returned to you. Past performance may not be repeated.
Unless otherwise indicated, the investment professionals featured do not manage Capital Group‘s Canadian investment funds.
References to particular companies or securities, if any, are included for informational or illustrative purposes only and should not be considered as an endorsement by Capital Group. Views expressed regarding a particular company, security, industry or market sector should not be considered an indication of trading intent of any investment funds or current holdings of any investment funds. These views should not be considered as investment advice nor should they be considered a recommendation to buy or sell.
Statements attributed to an individual represent the opinions of that individual as of the date published and do not necessarily reflect the opinions of Capital Group or its affiliates. This information is intended to highlight issues and not be comprehensive or to provide advice. For informational purposes only; not intended to provide tax, legal or financial advice. Capital Group funds are available in Canada through registered dealers. For more information, please consult your financial and tax advisors for your individual situation.
Forward-looking statements are not guarantees of future performance, and actual events and results could differ materially from those expressed or implied in any forward-looking statements made herein. We encourage you to consider these and other factors carefully before making any investment decisions and we urge you to avoid placing undue reliance on forward-looking statements.
The S&P 500 Composite Index (“Index”) is a product of S&P Dow Jones Indices LLC and/or its affiliates and has been licensed for use by Capital Group. Copyright © 2025 S&P Dow Jones Indices LLC, a division of S&P Global, and/or its affiliates. All rights reserved. Redistribution or reproduction in whole or in part are prohibited without written permission of S&P Dow Jones Indices LLC.
FTSE source: London Stock Exchange Group plc and its group undertakings (collectively, the "LSE Group"). © LSE Group 2025. FTSE Russell is a trading name of certain of the LSE Group companies. "FTSE®" is a trade mark of the relevant LSE Group companies and is used by any other LSE Group company under licence. All rights in the FTSE Russell indices or data vest in the relevant LSE Group company which owns the index or the data. Neither LSE Group nor its licensors accept any liability for any errors or omissions in the indices or data and no party may rely on any indices or data contained in this communication. No further distribution of data from the LSE Group is permitted without the relevant LSE Group company's express written consent. The LSE Group does not promote, sponsor or endorse the content of this communication. The index is unmanaged and cannot be invested in directly.
BLOOMBERG® is a trademark and service mark of Bloomberg Finance L.P. and its affiliates (collectively “Bloomberg”). Bloomberg or Bloomberg’s licensors own all proprietary rights in the Bloomberg Indices. Neither Bloomberg nor Bloomberg’s licensors approves or endorses this material, or guarantees the accuracy or completeness of any information herein, or makes any warranty, express or implied, as to the results to be obtained therefrom and, to the maximum extent allowed by law, neither shall have any liability or responsibility for injury or damages arising in connection therewith.
MSCI does not approve, review or produce reports published on this site, makes no express or implied warranties or representations and is not liable whatsoever for any data represented. You may not redistribute MSCI data or use it as a basis for other indices or investment products.
Capital believes the software and information from FactSet to be reliable. However, Capital cannot be responsible for inaccuracies, incomplete information or updating of the information furnished by FactSet. The information provided in this report is meant to give you an approximate account of the fund/manager's characteristics for the specified date. This information is not indicative of future Capital investment decisions and is not used as part of our investment decision-making process.
Indices are unmanaged and cannot be invested in directly. Returns represent past performance, are not a guarantee of future performance, and are not indicative of any specific investment.
All Capital Group trademarks are owned by The Capital Group Companies, Inc. or an affiliated company in Canada, the U.S. and other countries. All other company names mentioned are the property of their respective companies.
Capital Group funds are offered in Canada by Capital International Asset Management (Canada), Inc., part of Capital Group, a global investment management firm originating in Los Angeles, California in 1931. Capital Group manages equity assets through three investment groups. These groups make investment and proxy voting decisions independently. Fixed income investment professionals provide fixed income research and investment management across the Capital organization; however, for securities with equity characteristics, they act solely on behalf of one of the three equity investment groups.
The Capital Group funds offered on this website are available only to Canadian residents.