Market Volatility
China
Do proposed stimulus measures in China change the trajectory of its equity market and the economy? It will take more time to see what transpires, but recent actions are steps in the right direction, and as longtime China watchers, we are encouraged by the developments.
Following a slew of announced policy measures, including interest rate cuts, reductions in existing mortgage rates and billions in funds for state-owned firms to buy domestic equities, we think the intent of party leaders is now clearer.
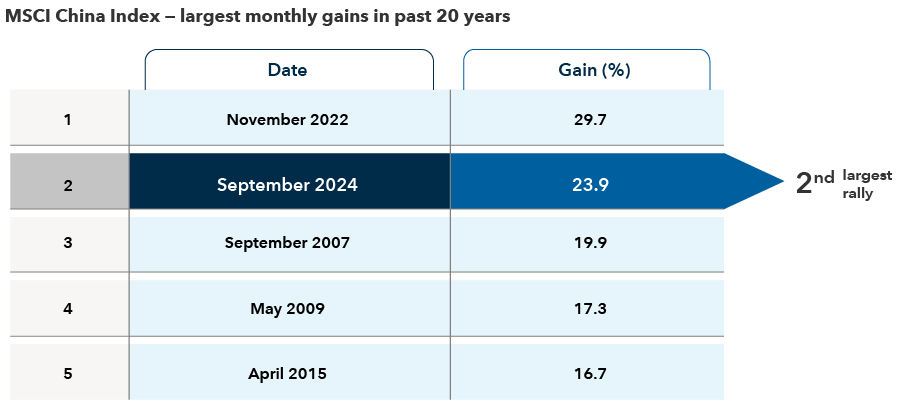
Top policymakers have acknowledged they must stop the decline in home prices to shore up the economy and consumer confidence. This is a significant development and a change in stance from four years ago. The impact has been felt in the stock market, with the MSCI China Index rallying 16% the last week of September, although the pace of gains has since slowed.
September’s rally was the second largest monthly gain in 20 years

Sources: MSCI, RIMES. Data reflects net returns in USD. Data as of September 30, 2024. Past results are not predictive of results in future periods.
Against this backdrop, these are our thoughts about investing in China now.
The latest stimulus measures signal change
Interest rate cuts are not new and have not significantly boosted equity markets in the past. But the apparent willingness of the government to focus on short-term growth rather than their medium-term ambitions is new, according to our Asia economist Stephen Green.
The government now aims to boost asset prices on the theory that sustained momentum could create a positive wealth effect, reversing the negative sentiment spiral — encouraging consumer spending and business investment. A notable shift is the People’s Bank of China’s willingness to accept riskier assets, such as stocks and ETFs, as collateral for borrowing.
A rebound in consumer confidence would help equity prices
We believe consumers must gain more confidence in the government’s array of stimulus measures if China’s stock market is to find a level of support and potentially move higher over time. Consumers have been cautious and more price conscious. They have been retrenching as well as deleveraging, focusing on repaying their mortgages.
On the upside, households have ample horsepower. The savings rate in China — the highest in the world — remains elevated even after COVID-induced lockdowns ended in late 2022. If some of the money can be routed to consumer spending and the country’s stock market, that would help improve China’s economic trajectory.
There were encouraging signs during the Golden Week holiday (October 1–7). Spending rose above 2019’s pre-pandemic level. Home buying activity also perked up in the bigger cities of Beijing, Shanghai and Shenzhen. And in Macau, a popular entertainment destination for gaming and shopping, there continue to be indications of recovery, with overall visits for 2024 tracking higher than last year.
China’s equity market has rerated but has room to expand
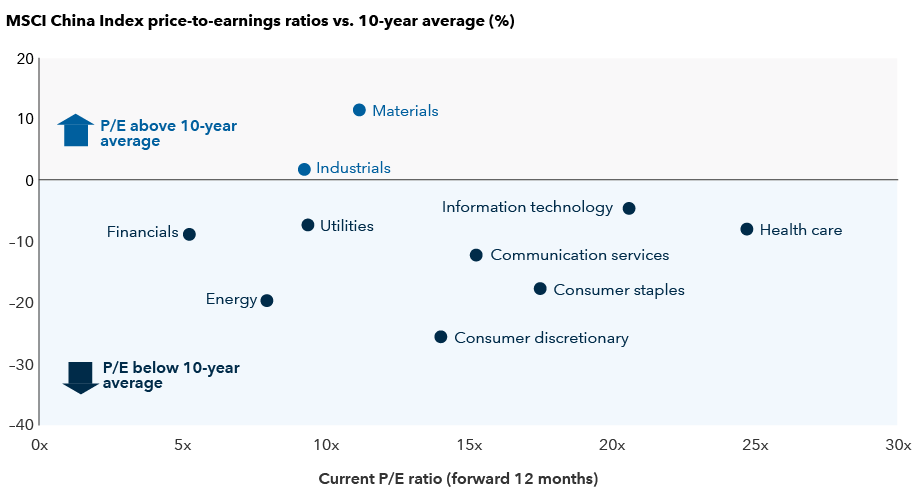
Valuations for some companies got ahead of fundamentals during the recent rally. That said, overall valuations for many Chinese stocks remain attractively valued, with the MSCI China Index trading at a discount to its 10-year average and the broader MSCI Emerging Markets (EM) Index. The MSCI China Index traded at 10.8 times earnings on a forward 12-month basis as of September 30, compared with 12.4 times for the benchmark EM index.
Valuations for most sectors trade below 10-year average

Sources: MSCI, RIMES. Forward price-to-earnings (P/E) ratios reflect the current share price relative to the consensus estimate for earnings per share on a forward 12-month basis. Data as of September 30, 2024.
There are signs of fundamental change that may boost valuations and improve returns on invested capital. Regulators are encouraging companies to pay more in dividends and pursue stock buybacks to improve shareholder returns, mirroring Japan’s playbook. Companies are prioritizing capital returns, notably among China’s leading internet companies, many of whom have increased their dividends and/or pledged to undertake share buybacks. Several of these companies have large amounts of cash on their balance sheets and trade at deeper discounts than their U.S. peers, despite having better technology in some cases.
For sentiment to improve, corporate earnings in China, which have weakened over the past year, will have to improve over the next six months.
Fiscal policies aside, what would likely be a big boost for sentiment is further support for China’s private sector economy. This is not just a real estate crisis but more importantly a domestic confidence crisis. Restoring confidence among entrepreneurs and the global venture capital community could help drive a sustainable recovery in the economy and capital markets.
Stock choice is key following recent market rally
Despite the rally, we still see value in certain areas of China’s market, but one must be selective. We’re constructive on domestic consumer brands in staples and sportswear. We also favour certain internet service platforms, mobile video game operators and travel-related companies. Broadly speaking, we are focused on companies that face waning industry competition, have the potential to improve margins, and can produce steady cash flows, especially in an uncertain policy and geopolitical environment.
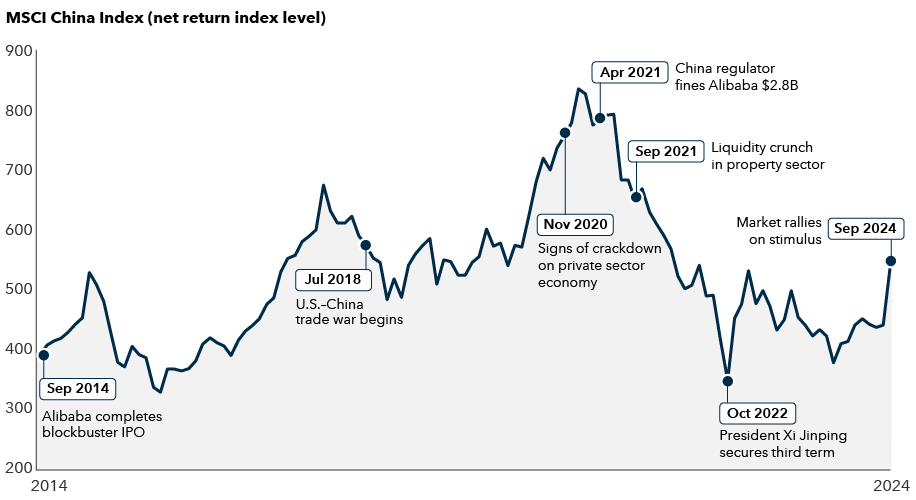
Stock picking in China has been crucial over past decade

Sources: MSCI, RIMES. Data reflects price level on a net basis. Data as of September 30, 2024. Past results are not predictive of results in future periods.
At this juncture, we are more positive about the direction of policy and are waiting to see the impact of proposed stimulus measures on various parts of the economy. China’s economic challenges are significant, but the government is taking steps to address them, and hopefully will do increasingly more until it works. Why? China is a far different economy than two decades ago. The middle class is much larger, the population is digitally savvy with innovative technology at their fingertips, and for China to be the geopolitical power that it aspires to be, it must have a strong economy. They also want to maintain social stability.
In previous periods of economic stress in China (2014, 2018 and 2021), party leaders have stepped up when they sense maximum pain in the economy. Furthermore, the regulatory headwinds that drove down share prices in recent years are abating, and at the margin, the policy environment is becoming more benign.
Bottom line
Big picture, we have to see whether this combination of monetary and proposed fiscal stimulus is going to change the trajectory of China’s economy from deflation to inflation, not only in property prices, but overall consumer prices. If the stimulus is not enough, deflation will persist, similar to what Japan experienced, and consumers will have the incentive to save. If modest inflation takes hold, both in property prices and in consumer prices, we could see a return of confidence and growth. In general, stimulating consumption is easier and cheaper but more temporary, whereas stabilizing the property market is tougher, more expensive but more powerful.
The MSCI China Index captures large- and mid-cap representation across China A shares, H shares, B shares, Red chips, P chips and foreign listings (e.g. ADRs). With 714 constituents, the index covers about 85% of this China equity universe.
Our latest insights
-
-
Market Volatility
-
Markets & Economy
-
-
Market Volatility
RELATED INSIGHTS
-
-
Chart in Focus
-
U.S. Equities
Commissions, trailing commissions, management fees and expenses all may be associated with investments in investment funds. Please read the prospectus before investing. Investment funds are not guaranteed or covered by the Canada Deposit Insurance Corporation or by any other government deposit insurer. For investment funds other than money market funds, their values change frequently. For money market funds, there can be no assurances that the fund will be able to maintain its net asset value per security at a constant amount or that the full amount of your investment in the fund will be returned to you. Past performance may not be repeated.
Unless otherwise indicated, the investment professionals featured do not manage Capital Group‘s Canadian investment funds.
References to particular companies or securities, if any, are included for informational or illustrative purposes only and should not be considered as an endorsement by Capital Group. Views expressed regarding a particular company, security, industry or market sector should not be considered an indication of trading intent of any investment funds or current holdings of any investment funds. These views should not be considered as investment advice nor should they be considered a recommendation to buy or sell.
Statements attributed to an individual represent the opinions of that individual as of the date published and do not necessarily reflect the opinions of Capital Group or its affiliates. This information is intended to highlight issues and not be comprehensive or to provide advice. For informational purposes only; not intended to provide tax, legal or financial advice. Capital Group funds are available in Canada through registered dealers. For more information, please consult your financial and tax advisors for your individual situation.
Forward-looking statements are not guarantees of future performance, and actual events and results could differ materially from those expressed or implied in any forward-looking statements made herein. We encourage you to consider these and other factors carefully before making any investment decisions and we urge you to avoid placing undue reliance on forward-looking statements.
The S&P 500 Composite Index (“Index”) is a product of S&P Dow Jones Indices LLC and/or its affiliates and has been licensed for use by Capital Group. Copyright © 2025 S&P Dow Jones Indices LLC, a division of S&P Global, and/or its affiliates. All rights reserved. Redistribution or reproduction in whole or in part are prohibited without written permission of S&P Dow Jones Indices LLC.
FTSE source: London Stock Exchange Group plc and its group undertakings (collectively, the "LSE Group"). © LSE Group 2025. FTSE Russell is a trading name of certain of the LSE Group companies. "FTSE®" is a trade mark of the relevant LSE Group companies and is used by any other LSE Group company under licence. All rights in the FTSE Russell indices or data vest in the relevant LSE Group company which owns the index or the data. Neither LSE Group nor its licensors accept any liability for any errors or omissions in the indices or data and no party may rely on any indices or data contained in this communication. No further distribution of data from the LSE Group is permitted without the relevant LSE Group company's express written consent. The LSE Group does not promote, sponsor or endorse the content of this communication. The index is unmanaged and cannot be invested in directly.
BLOOMBERG® is a trademark and service mark of Bloomberg Finance L.P. and its affiliates (collectively “Bloomberg”). Bloomberg or Bloomberg’s licensors own all proprietary rights in the Bloomberg Indices. Neither Bloomberg nor Bloomberg’s licensors approves or endorses this material, or guarantees the accuracy or completeness of any information herein, or makes any warranty, express or implied, as to the results to be obtained therefrom and, to the maximum extent allowed by law, neither shall have any liability or responsibility for injury or damages arising in connection therewith.
MSCI does not approve, review or produce reports published on this site, makes no express or implied warranties or representations and is not liable whatsoever for any data represented. You may not redistribute MSCI data or use it as a basis for other indices or investment products.
Capital believes the software and information from FactSet to be reliable. However, Capital cannot be responsible for inaccuracies, incomplete information or updating of the information furnished by FactSet. The information provided in this report is meant to give you an approximate account of the fund/manager's characteristics for the specified date. This information is not indicative of future Capital investment decisions and is not used as part of our investment decision-making process.
Indices are unmanaged and cannot be invested in directly. Returns represent past performance, are not a guarantee of future performance, and are not indicative of any specific investment.
All Capital Group trademarks are owned by The Capital Group Companies, Inc. or an affiliated company in Canada, the U.S. and other countries. All other company names mentioned are the property of their respective companies.
Capital Group funds are offered in Canada by Capital International Asset Management (Canada), Inc., part of Capital Group, a global investment management firm originating in Los Angeles, California in 1931. Capital Group manages equity assets through three investment groups. These groups make investment and proxy voting decisions independently. Fixed income investment professionals provide fixed income research and investment management across the Capital organization; however, for securities with equity characteristics, they act solely on behalf of one of the three equity investment groups.
The Capital Group funds offered on this website are available only to Canadian residents.
 Victor Kohn
 Saurav Jain
 Kent Chan