Chart in Focus
Bonds
Bond markets had a difficult year in 2022 as the Fed aggressively hiked interest rates to stamp out inflation. With the end of rate increases in sight, investors may be wondering if volatility may be replaced with relative tranquility in the year ahead.
At its December meeting, the U.S. Federal Reserve moderated its approach and lifted rates by half a percentage point to a range of 4.25% to 4.50%. Investors welcomed the downshift after an unprecedented string of four 75 basis point adjustments by policymakers attempting to quash decades-high inflation. But officials underscored that they will continue to raise rates to around 5% next year.
Wide-ranging challenges still lie ahead. Among them: Inflation remains stubbornly high, and economic activity is expected to slow or contract.
Here, fixed income portfolio managers from across Capital Group weigh in about what’s next for bonds.
Inflation has likely peaked, but should remain high
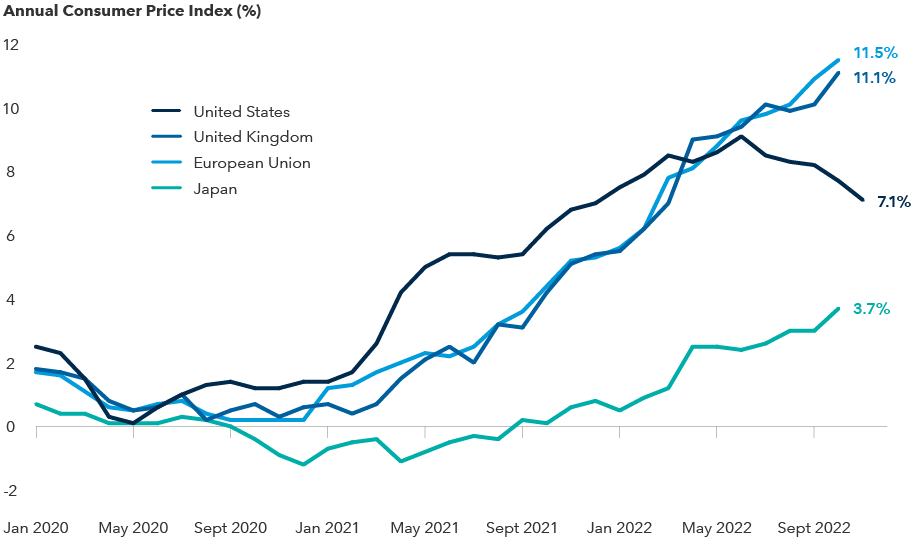
Even the most optimistic investors are bracing for a recession. The question is more a matter of how wide or deep the downturn will be as central banks worldwide raise rates to try to contain inflation. With growth expected to stall or contract in major economies including the United Kingdom, European Union, Japan and the United States, will high prices stick around in 2023?
Inflation remains high in most economies

Source: Refinitiv Datastream. U.S. data as of 11/30/22. Data for other countries/regions is current as of 10/31/22. Consumer Price Index (CPI), a commonly used measure of inflation, measures the average change over time in the prices paid by consumers for a basket of goods and services.
Demand for sectors that quickly absorb rate increases, such as housing, has predictably declined. Other areas of the economy will take more time to cool.
“The impact of rate hikes will unfold over the next several months, likely in the form of higher unemployment, fewer job openings and declining retail sales,” says Ritchie Tuazon, portfolio manager for American Funds Strategic Bond FundSM.
So far, the economy has coped surprisingly well. Ironically, bright spots could feed into the inflation problem.
“Supply chain issues appear to have worked themselves out, but the labor shortage and persistent wage growth could keep inflation higher than the Fed’s 2% target range for some time,” Tuazon says. Geopolitical risks could further undermine the Fed’s efforts.
“There is a flavor of stagflation ahead,” Tuazon adds. Stagflation, the much-feared mix of stagnant economic growth, high unemployment and soaring prices, warrants an active approach to bond investing. “I see select opportunities within the Treasury yield curve as well as Treasury Inflation-Protected Securities.”
Bond funds should once again offer relative stability
Fixed income's role as a portfolio ballast when stocks are falling was of no help as the Fed continuously revised rate expectations upward.
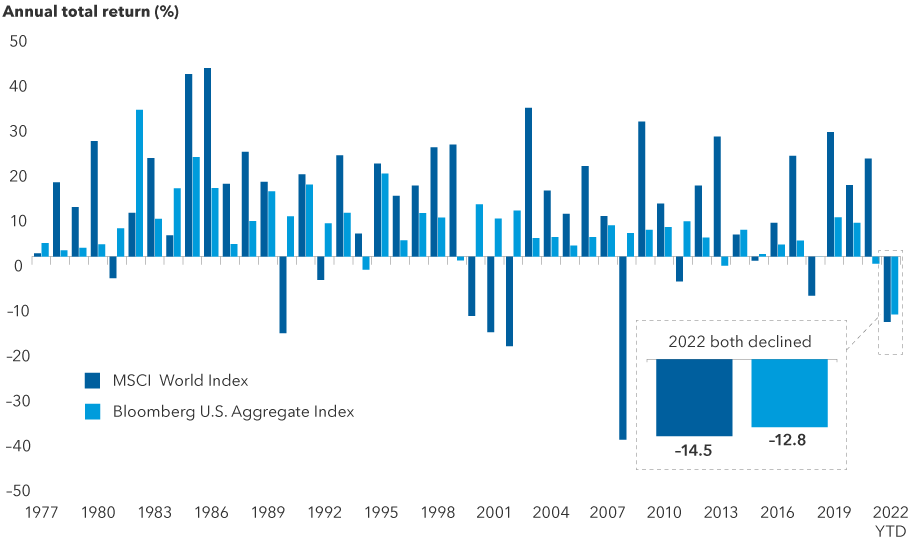
It’s rare for both stocks and bonds to fall in tandem in a calendar year. In fact, 2022 marks the only time it occurred in 45 years. That’s because the Fed hiked aggressively when rates were near zero.
Stocks and bonds rarely decline in tandem

Sources: Capital Group, Bloomberg Index Services Ltd., MSCI. Returns above reflect annual total returns in USD for all years except 2022, which reflect the year-to-date total return for both indexes. As of 11/30/22. Past results are not predictive of results in future periods.
That should change in 2023 as inflation moderates. “Once the Fed pivots from its ultra-hawkish monetary policy stance, high-quality bonds should again offer relative stability and greater income,” according to Pramod Atluri, portfolio manager for The Bond Fund of America®.
As additional cracks start to show in the economy, recession fears may take center stage. “One way or another, the consumer is going to feel more stressed in 2023. Either the economy is so strong it continues to feed into inflation, or the economy weakens and unemployment rises,” Atluri says.
But slowing growth and moderating inflation could be a good thing for high-quality fixed income. They should lead to lower yields and higher bond prices. Staying on the sidelines to wait out market volatility could mean giving up on income opportunities and the potential for an even higher total return. “Valuations are attractive, so I am selectively adding corporate credit,” Atluri says. “Bonds now offer a much healthier income stream, which should help offset any price declines.”
Investing six months prior to the final rate hike would have provided strong returns

Sources: Capital Group, Bloomberg. Right chart shows date of the last hike in all Fed hiking periods since 1980, excluding the 2018 peak which does not yet have five years of data. Hypothetical 12-month dollar cost average return is the total return for a level monthly investment for 12 months starting six months prior to each last rate hike. The hypothetical five-year return annualizes the total return for that first 12 months plus four more years, assuming no additional investment after that first year. Regular investing does not ensure a profit or protect against loss. Investors should consider their willingness to keep investing when share prices are declining. Past results are not predictive of results in future periods.
Historically, investing prior to the final rate hike in a cycle would have paid off. In the last 40 years, there were six hiking cycles that offer five years of returns data. Purchasing bonds regularly for a year starting six months prior to the last Fed rate hike in each of those cycles would have returned a range of 3.3% to 10.2% in the first 12 months. Longer term, that year-long investment would have provided a five-year annualized total return that spanned from 5.9% to 15.6%.
Income is back in fixed income
Bond market losses can be painful to endure, as rising rates cause bond prices to decline. The upside is that bond yields also rise, which may set the stage for higher income down the road.
The yield on the benchmark 10-year U.S. Treasury hovered around 3.47% on December 14, 2022, versus a yield of 1.51% on December 31, 2021. Yields, which rise when bond prices fall, have soared across sectors. Over time, income should increase since the total return of a bond fund consists of price changes and interest paid, and the interest component is higher.
Yields have soared across asset classes

Sources: Bloomberg, Bloomberg Index Services Ltd., JPMorgan. As of 11/30/22. Sector yields above include Bloomberg U.S. Aggregate Index, Bloomberg U.S. Corporate Investment Grade Index, Bloomberg U.S. Corporate High Yield Index, 50% J.P. Morgan EMBI Global Diversified Index/50% J.P. Morgan GBI-EM Global Diversified Index blend and Bloomberg Municipal Bond Index. Period of time considered from 2020 to present. Dates for recent lows from top to bottom in chart shown are: 8/4/20, 12/31/20, 7/6/21, 1/4/21 and 7/27/21. Yields shown are yield to worst. Yield to worst is the lowest yield that can be realized by either calling or putting on one of the available call/put dates or holding a bond to maturity. "Change" figures may not reconcile due to rounding.
With investors better compensated for holding relatively stable bonds, the question of whether to invest in riskier corporate or high-yield bonds ahead of a potential recession is an important one.
Despite gloomy headlines, consumers continue to open their wallets. “This has helped keep corporate balance sheets in pretty good shape,” says Damien McCann, fixed income portfolio manager for American Funds Multi-Sector Income FundSM.
The reward potential for corporate investment-grade bonds (BBB/Baa and higher) at current levels is enticing, but many are vulnerable in a downturn. “I expect credit quality to weaken as the economy slows. In that environment, I prefer defensive sectors such as health care over homebuilders and retail,” McCann says.
High-yield bonds are also relatively well positioned for an economic slowdown, and their prices have declined sharply. An uptick in defaults, which the market has already priced in, could still increase in a deep recession.
“We went through a significant default cycle with the pandemic,” says David Daigle, bond manager for American High-Income Trust®. “The underlying credit quality of the asset class has improved markedly since 2008. I do expect fundamentals to weaken from here so I’m positioning the funds I manage to have less exposure to consumer cyclicals such as automotive and leisure since demand for their products and services will likely soften.”
Municipal bonds are well positioned ahead of a downturn
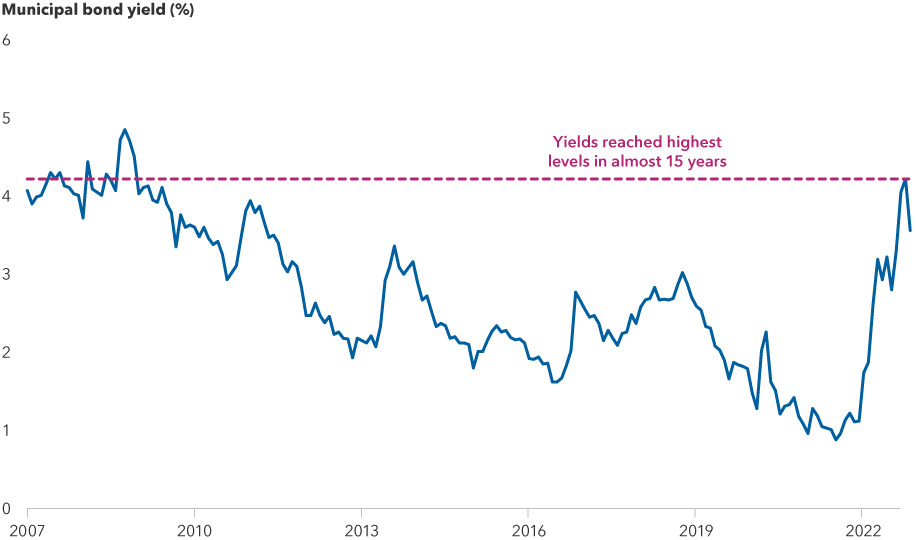
The Fed-induced selloff sent municipal bond yields to near 15-year highs. For patient, long-term investors, that can make munis particularly attractive.
Historically, the allure of munis was their federal and often state tax-exempt status. Because of that, they generally have yielded less than comparable taxable bonds. Decades of low rates translated into modest income payments.
According to fixed income portfolio manager Karl Zeile, “Muni yields are reaching levels where the tax-exempt income is attractive.” The Bloomberg Municipal Bond Index was down 8.8% in 2022 (through November 30) and yielded 3.6%, which is the equivalent of a 6.0% yield for investors in the highest tax bracket. The highest tax rate assumes the 3.8% Medicare tax and the top federal marginal tax rate for 2022 of 37%.
Muni bond yields offer attractive entry point

Sources: Bloomberg Index Services Ltd. As of 11/30/22. Yields shown are yield to worst. Yield to worst is the lowest yield that can be realized by either calling or putting on one of the available call/put dates or holding a bond to maturity.
“Thanks to robust employment and significant aid through the American Rescue Plan, state balance sheets are broadly in good shape,” Zeile reports.
Revenues have increased for some project-specific bonds such as toll roads, colleges and universities since they were able to pass higher costs to consumers. These so-called revenue bond issuers tend to issue long-term debt, so many have low fixed debt payments.
Lower tax revenue and other negative recessionary impacts take longer to flow to munis compared to corporate credit and high-yield bonds.
With many opportunities in higher rated issuers, “valuations don’t yet reward the risk of going meaningfully down in credit quality,” Zeile adds.
Why bonds are back
After a difficult year for bonds, there are reasons for optimism. Inflation has moderated, and Fed rate hikes are likely to peak in the not-too-distant future. Higher yields and the specter of a recession could also send investors back into bonds in search of relative stability and income.
Today’s starting yields can offer an attractive entry point for investors and provide a cushion to further volatility. There are also compelling opportunities across asset classes that an active manager can uncover via bottom-up research and security selection.
Investing outside the United States involves risks, such as currency fluctuations, periods of illiquidity and price volatility, as more fully described in the prospectus. These risks may be heightened in connection with investments in developing countries.
The return of principal for bond funds and for funds with significant underlying bond holdings is not guaranteed. Fund shares are subject to the same interest rate, inflation and credit risks associated with the underlying bond holdings. Lower rated bonds are subject to greater fluctuations in value and risk of loss of income and principal than higher rated bonds. Income from municipal bonds may be subject to state or local income taxes and/or the federal alternative minimum tax. Certain other income, as well as capital gain distributions, may be taxable. While not directly correlated to changes in interest rates, the values of inflation linked bonds generally fluctuate in response to changes in real interest rates and may experience greater losses than other debt securities with similar durations. The use of derivatives involves a variety of risks, which may be different from, or greater than, the risks associated with investing in traditional cash securities, such as stocks and bonds. Bond ratings, which typically range from AAA/Aaa (highest) to D (lowest), are assigned by credit rating agencies such as Standard & Poor's, Moody's and/or Fitch, as an indication of an issuer's creditworthiness.
The indexes are unmanaged and, therefore, have no expenses. Investors cannot invest directly in an index.
Bloomberg U.S. Aggregate Index represents the U.S. investment-grade fixed-rate bond market.
Bloomberg U.S. Corporate High Yield Index covers the universe of fixed-rate, non-investment-grade debt.
Bloomberg U.S. Corporate Investment Grade Index represents the universe of investment grade, publicly issued U.S. corporate and specified foreign debentures and secured notes that meet the specified maturity, liquidity and quality requirements.
Bloomberg Municipal Bond Index is a market value-weighted index designed to represent the long-term investment-grade tax-exempt bond market.
The J.P. Morgan Emerging Market Bond Index (EMBI) Global Diversified is a uniquely weighted emerging market debt benchmark that tracks total returns for U.S. dollar-denominated bonds issued by emerging market sovereign and quasi-sovereign entities. J.P. Morgan Government Bond Index — Emerging Markets (GBI-EM) Global Diversified covers the universe of regularly traded, liquid fixed-rate, domestic currency emerging market government bonds to which international investors can gain exposure. The 50%/50% J.P. Morgan EMBI Global/J.P. Morgan GBI-EM Global Diversified blends the J.P. Morgan EMBI Global Index with the J.P. Morgan GBI-EM Global Diversified Index by weighting their cumulative total returns at 50% each. This assumes the blend is rebalanced monthly.
MSCI ACWI is a free float-adjusted market capitalization-weighted index designed to measure equity market results in the global developed and emerging markets, consisting of more than 40 developed and emerging market country indexes.
BLOOMBERG® is a trademark and service mark of Bloomberg Finance L.P. and its affiliates (collectively “Bloomberg”). Bloomberg or Bloomberg’s licensors own all proprietary rights in the Bloomberg Indices. Neither Bloomberg nor Bloomberg’s licensors approves or endorses this material, or guarantees the accuracy or completeness of any information herein, or makes any warranty, express or implied, as to the results to be obtained therefrom and, to the maximum extent allowed by law, neither shall have any liability or responsibility for injury or damages arising in connection therewith.
This report, and any product, index or fund referred to herein, is not sponsored, endorsed or promoted in any way by J.P. Morgan or any of its affiliates who provide no warranties whatsoever, express or implied, and shall have no liability to any prospective investor, in connection with this report. J.P. Morgan disclaimer: https://www.jpmm.com/research/disclosures.
MSCI has not approved, reviewed or produced this report, makes no express or implied warranties or representations and is not liable whatsoever for any data in the report. You may not redistribute the MSCI data or use it as a basis for other indices or investment products.
Our latest insights
-
-
Economic Indicators
-
Demographics & Culture
-
Emerging Markets
-
RELATED INSIGHTS
-
Markets & Economy
-
Asset Allocation
-
Never miss an insight
The Capital Ideas newsletter delivers weekly insights straight to your inbox.
 Pramod Atluri
 Damien McCann
 Ritchie Tuazon