Retirement Income

3 key considerations for sustainable retirement income

KEY TAKEAWAYS

  • The ability to adjust withdrawals in response to investment returns can enhance the sustainability of a retirement income portfolio.
  • A retiree’s planning horizon is a major consideration when identifying a sustainable withdrawal rate.
  • The desire to leave a larger legacy calls for a more conservative withdrawal rate.

Retirement income planning often centers around a key question: How much can I withdraw from my retirement portfolio? Striking the right balance is crucial: Excessive withdrawals can deplete the portfolio prematurely, while overly conservative withdrawals may result in a lower standard of living than desired.


Our analysis revealed that this critical calculation is not one size fits all. Each retiree will have individual goals, risk tolerance and other unique factors. Such factors, including spending flexibility, retirement planning horizon and legacy goals, play an important role in determining a sustainable withdrawal rate, which may fluctuate over time.


Beyond the 4% rule


The 4% rule, suggesting a 4% initial withdrawal over 30 years and adjusting for inflation, is widely known. However, it lacks flexibility and assumes no changes in spending or investment mix. Although it can be a starting point, personalization is crucial.


But the 4% rule is not the only approach. Retirees can explore various other withdrawal approaches. Our research on retirement withdrawal strategies revealed several potential approaches, but this discussion will focus only on two fundamental withdrawal strategies: fixed and variable.


Consider two potential spending patterns for the same hypothetical 60/40 portfolio: one with recurring 3% annual withdrawal increases to account for inflation or cost of living adjustments, and another with 3% increases only during the years the portfolio’s value increases, with no such increases in the year after its value declines (defined as when portfolio return was less than $0).

Flexibility in withdrawals can have a big impact on success potential

The chart compares the likelihood of not running out of money for a hypothetical portfolio over 30 years. It assumes two initial withdrawal rates: 4% and 3%. At the 4% rate, adding recurring 3% annual withdrawals potentially results in a 69% probability of not running out of money. Limiting increases to years when the portfolio’s value rises potentially yields an 82% probability of not running out. At the 3% rate, recurring 3% annual withdrawal increases potentially lead to a 93% probability of not running out of money. Limiting increases to only those years when the portfolio’s value rises yields a potential 98% probability of not running out.

(Chart based on hypothetical scenarios.)

Source: Capital Group calculations based on a hypothetical Monte Carlo analysis. The chart represents two potential spending patterns for the same hypothetical portfolio. We calculated the hypothetical investment outcomes of these personalized portfolios using Capital Group’s capital markets assumptions (CMAs) for global equities (represented by the MSCI All Country World Index) and U.S. aggregate fixed income (represented by the Bloomberg U.S. Aggregate Index). We assumed a 60% allocation to equities and 40% to fixed income. The chart shows an increase in the likelihood of having a remaining ending balance given changes in withdrawal rate and inflation increases. Fees are not included. Neither past results nor capital market assumptions can guarantee future performance. For further information about the assumptions used to create this chart, refer to the end of this article.

The tradeoffs are evident. Strategies with variable withdrawal amounts  starting with either 3% or 4% initial withdrawals that adjust for portfolio fluctuations may potentially increase the probability of money lasting more than 30 years. The constant withdrawal strategy may be appealing for retirees wishing to mimic the predictable cash flow of a paycheck. However, this approach, much like the 4% rule, may deplete the portfolio faster due to lack of adjustments to withdrawals.


Taxes and investment expenses should not be overlooked, as they will also impact sustainable withdrawals. For example, our research found that when a 1% fee is included in a variable withdrawal scenario over 30 years, at a 3% withdrawal rate the probability of success drops from 98% to 94%, and at a 4% withdrawal rate it drops from 82% to 67%.


However, don’t overestimate the impact of fees by unnecessarily limiting clients’ spending because fees often decrease when account values decline. Along with flexible withdrawal strategies, retirees can use protected lifetime income like annuities, pensions and/or Social Security to help reduce some of the withdrawal stress

Retirement planning horizons and withdrawal rates

As expected, the length of retirement significantly influences portfolio withdrawal rates. A typical 30-year planning horizon may require a lower initial withdrawal rate to be sustainable. For example, a 65-year-old investor planning for a 30-year retirement horizon should spend less initially than an 85-year-old investor with a 10-year horizon.


A shorter retirement planning horizon due to delayed retirement or health conditions may justify a higher initial withdrawal but could potentially lead to overspending.  We analyzed a hypothetical 60/40 portfolio with various fixed withdrawal rates, with the goal of achieving a 90% probability of success.* Incorporating annual withdrawal increases of 3% to combat inflation results in shorter planning horizons with higher withdrawal rates.


When choosing an initial withdrawal rate, be sure to consider an investor’s longevity risk tolerance, life expectancy and cash flow predictability. In general, younger clients or those with a longer life expectancy should have lower initial withdrawal rates, especially if they are interested in maintaining assets for heirs or charity.

The length of retirement and initial withdrawal rate matter

The bar chart illustrates the relationship between withdrawal rates from a hypothetical retirement portfolio and the expected lifespan of the portfolio. The y-axis represents different withdrawal rates, ranging from 1% to 8%. The bars indicate the years of portfolio survival at each respective withdrawal rate. For 1% and 2% withdrawal rates, the portfolio is expected to last 30+ years. At a 3% withdrawal rate, the portfolio is expected to last for 28 to 29 years, at 4%: 21 to 22 years; at 5%: 16 to 17 years; at 6%: 14 to 15 years, at 7%: 12 to 13 years and at 8%: 10 to 11 years.

(Chart based on hypothetical scenarios.)

Source: Capital Group calculations based on a hypothetical Monte Carlo analysis. We calculated the hypothetical investment outcomes of these personalized portfolios using Capital Group’s capital markets assumptions (CMAs) for global equities (represented by the MSCI All Country World Index) and U.S. aggregate fixed income (represented by the Bloomberg U.S. Aggregate Index). We assumed a 60% allocation to equities and 40% to fixed income with 3% annual increases to adjust for inflation, plus 1% portfolio fees. Neither past results nor capital market assumptions can guarantee future performance. 

Considerations for legacy goals

Certain withdrawal methods may be better for maximizing current spending, while others excel in preserving one’s nest egg for a future legacy. A fixed-dollar strategy balances current spending needs while a variable strategy may help preserve the retirement portfolio to meet legacy goals. Adjusting withdrawal rates based on goals is crucial for efficient portfolio use.


For example, legacy-focused investors often favor lower withdrawal rates. Our analysis found that an investor looking to preserve at least 50% of their account balance over a 30-year horizon may consider a 3.00% fixed withdrawal to meet this objective. If the legacy goal decreases to 25% of the account balance, the fixed withdrawal rate may increase to 3.25%. 

Optimal withdrawal rates for retirement and legacy goals

The chart is a scatter plot showing the relationship between portfolio withdrawal rates and retirement time horizons for different legacy goals. The x-axis represents the retirement time horizon in years, ranging from 0 to 30 years. The y-axis represents the portfolio withdrawal rate, ranging from 0% to 10%. There are three series of data points representing retirement legacy goals and their optimal withdrawal rates, respectively: For a 0% legacy goal, the optimal withdrawal rates start at 9.00% for both a five- and 10-year retirement horizon, decreasing to 6.25%, 5.00%, 4.00% and 3.50% for 15-, 20-, 25- and 30-year horizons, respectively. For a 25% legacy goal, the withdrawal rate starts at 9.00% for 5 years, decreasing to 7.50%, 5.25%, 4.25%, 3.75% and 3.25% for 10-, 15-, 20-, 25- and 30-year horizons, respectively. For a 50% legacy goal, the withdrawal rates start at 9.00% for 5 years, decreasing to 5.50%, 4.25%, 3.50%, 3.25% and 3.00% for 10-, 15-, 20-, 25- and 30-year horizons, respectively.

(Chart based on hypothetical scenarios.)

Source: Capital Group calculations based on a hypothetical Monte Carlo analysis. We then calculated the hypothetical investment outcomes of these personalized portfolios using Capital Group’s capital markets assumptions (CMAs) for global equities (represented by the MSCI All Country World Index) and U.S. aggregate fixed income (represented by the Bloomberg U.S. Aggregate Index). We assumed a 60% allocation to equities and 40% to fixed income with fixed withdrawals starting in the first year of retirement and continuing for the time horizon indicated. Withdrawals are increased by 2.25% each year after the first year to adjust for inflation. Taxes and fees are not included. Neither past results nor capital market assumptions can guarantee future performance.

Retirees who are primarily focused on maximizing their own lifetime income may benefit from a flexible withdrawal strategy during robust market periods. The probability of success involves balancing a retiree’s income and legacy objectives, not just avoiding portfolio depletion. Unexpected longevity can affect legacy planning as well. Financial professionals may aim to secure wealth beyond the planned horizon for this reason.

Putting it all together

Developing and overseeing a retirement-spending strategy can be complex. Focusing on these three key areas may help you create meaningful client conversations:


  • Flexibility: Discuss the importance of adjusting expenses in response to changing conditions. Ask your client, “How flexible can you be with your expenses?” The more a portfolio is relied on to support income needs, the more flexible a retiree may need to be. This flexibility often translates into a more conservative withdrawal rate. This calculator can help you demonstrate how protected lifetime income can impact your client's portfolio reliance and withdrawal rates. Stay flexible and evaluate the plan annually and when significant life events occur.

  • Planning horizon: Ask, “How long do you plan to live off your retirement savings?” The answer can help you tailor a withdrawal rate that aligns with their life expectancy. Remember, the younger a client or the longer their life expectancy, the more conservative the initial withdrawal rate should be.

  • Legacy goals: Understand your client’s legacy goals. Ask, “Do you want to maximize your income today or focus on leaving a legacy for tomorrow?” A larger legacy goal necessitates a more conservative withdrawal rate.
KTEB

Kate Beattie is a senior retirement income strategist with 17 years of investment industry experience (as of 12/31/2023). She holds a bachelor’s degree in economics with a business administration minor from Colorado State University and holds the Certified Financial Planner™ and Retirement Income Certified Professional® designations.

*A 90% probability of success factor in a Monte Carlo simulation strikes a balance between conservative and aggressive planning. It is often utilized to ensure a high level of confidence that hypothetical outcomes have the potential to be achieved, accommodating for potential uncertainties and variations in the model. A lower probability would accept a potential higher risk with a greater chance the projected outcomes may fall short. 


A Monte Carlo simulation was used to calculate the probable range of outcomes and probabilities for hypothetical portfolio reliance.


Information about Monte Carlo simulations: Monte Carlo simulation is a statistical technique that, through a large number of random scenarios, calculates estimated returns and a range of outcomes that is based on the assumptions included in this analysis. This is provided for informational purposes only and is not intended to provide any assurance of actual results. The simulation will not capture low-probability, high-impact outcomes. The results of the simulations may be presented in the form of percentiles, reflecting the probability distribution of the portfolio values and statistics. While we believe the calculations to be reliable, we cannot guarantee their accuracy.


The following assumptions were used in the Monte Carlo simulation:


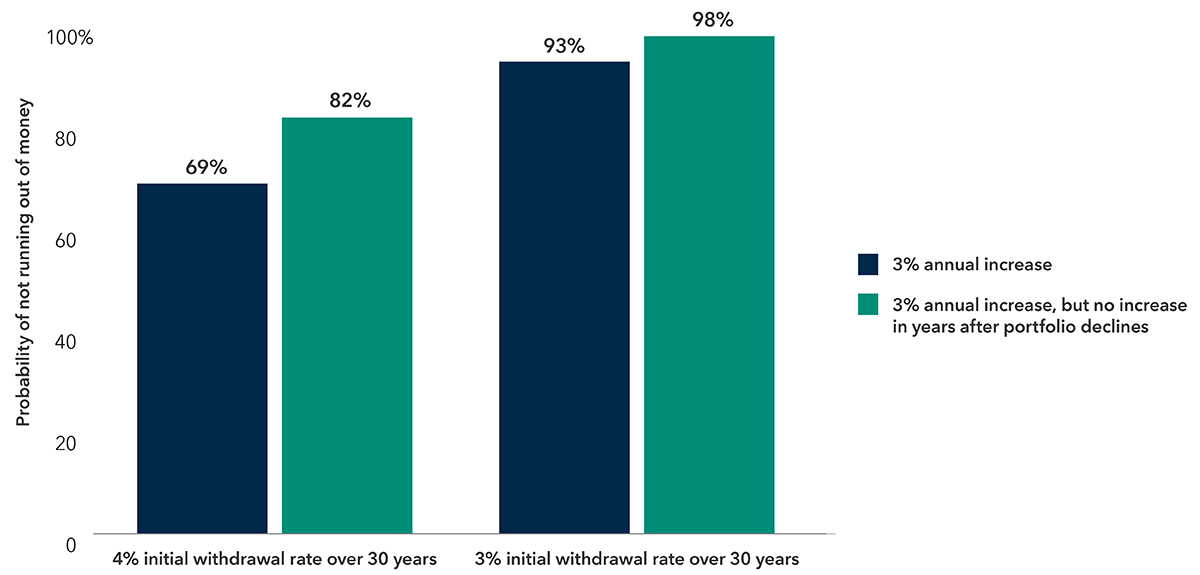
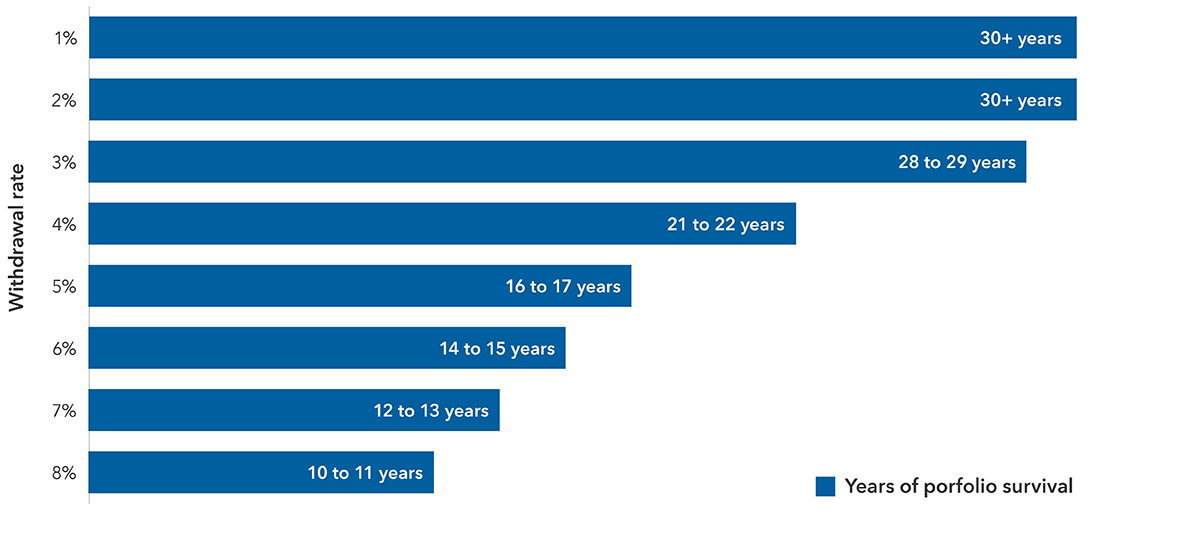
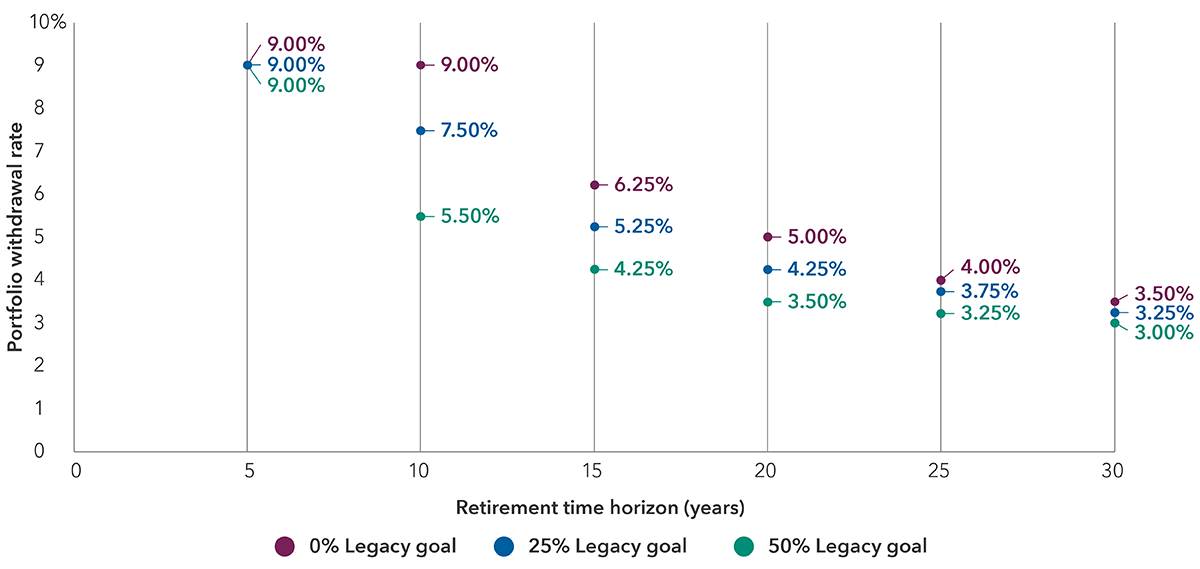
  • The investor withdraws a fixed percentage of the initial portfolio value each year for up to 30 years. Withdrawals are increased by either 2.25% or 3.0% where noted each year after the first year to adjust for inflation.
  • The 3% and 4% withdrawal rate scenarios are shown for illustrative purposes only.
  • The hypothetical portfolio used in these simulations employed Capital Group’s capital markets assumptions (CMAs) for 60% global equities (represented by the MSCI All Country World Index) and 40% U.S. aggregate fixed income (represented by the Bloomberg U.S. Aggregate Index). Assumed hypothetical returns for the equity portfolios were 6.5% with a standard deviation of 15.6%; assumed hypothetical returns for U.S. fixed income were 4.1% with a standard deviation of 3.9% as of December 31, 2023.


The portfolio success rate in the hypothetical illustration is the percentage of simulations where the hypothetical portfolio sustained the applicable withdrawal percentage each year for 30 years (inclusive of a 2.25% or 3.0% annual inflation increase where noted). While we believe the calculations to be reliable, we cannot guarantee their accuracy. Simulation results may vary.


About capital markets assumptions: This analysis represents the views of a small group of investment professionals based on their individual research and are approved by the Capital Market Assumptions Oversight Committee. They should not be interpreted as the view of Capital Group as a whole. As Capital Group employs The Capital System™, the views of other individual analysts and portfolio managers may differ from those presented here. They are provided for informational purposes only and are not intended to provide any assurance or promise of actual returns. They reflect long-term projections of asset class returns and are based on the respective benchmark indices, or other proxies, and therefore do not include any fees or any outperformance gain or loss that may result from active portfolio management. Note that the actual results will be affected by any adjustments to the mix of asset classes. All market estimates are subject to a wide margin of error.


Standard deviation (based on monthly returns) is a common measure of absolute volatility that tells how returns over time have varied from the mean. A lower number signifies lower volatility.


MSCI All Country World Index is a free float-adjusted market capitalization-weighted index that is designed to measure equity market results in the global developed and emerging markets, consisting of more than 40 developed and emerging market country indexes. Results reflect dividends gross of withholding taxes through December 31, 2000, and dividends net of withholding taxes thereafter. Bloomberg U.S. Aggregate Index represents the U.S. investment-grade fixed-rate bond market. These indexes are unmanaged, and their results include reinvested dividends and/or distributions but do not reflect the effect of sales charges, commissions, account fees, expenses or U.S. federal income taxes.

Investments are not FDIC-insured, nor are they deposits of or guaranteed by a bank or any other entity, so they may lose value.
Investors should carefully consider investment objectives, risks, charges and expenses. This and other important information is contained in the fund prospectuses and summary prospectuses, which can be obtained from a financial professional and should be read carefully before investing.
Statements attributed to an individual represent the opinions of that individual as of the date published and do not necessarily reflect the opinions of Capital Group or its affiliates. This information is intended to highlight issues and should not be considered advice, an endorsement or a recommendation.
All Capital Group trademarks mentioned are owned by The Capital Group Companies, Inc., an affiliated company or fund. All other company and product names mentioned are the property of their respective companies.
Use of this website is intended for U.S. residents only. Use of this website and materials is also subject to approval by your home office.
Capital Client Group, Inc.
This content, developed by Capital Group, home of American Funds, should not be used as a primary basis for investment decisions and is not intended to serve as impartial investment or fiduciary advice.