Global Equities
- Because this economic decline is policy driven, a solid recovery is likely as lockdowns end.
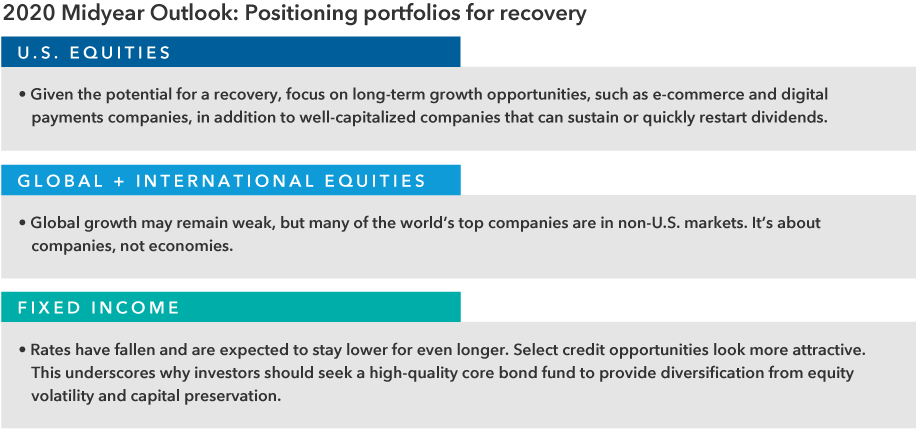
- Easy monetary policy, aggressive fiscal policy and zero-bound interest rates should continue to support equity markets.
- It’s not too late to upgrade your fixed income allocation as rates are likely to remain lower for longer.
U.S. Midyear Outlook: From recession to recovery
In the opening weeks of 2020, investors had very few hints of the daunting events to come in this most unusual year. The U.S. economy was humming along nicely. Unemployment levels declined to 50-year lows. And the stock market hit record new highs almost like clockwork.
That was then. This is now.
Over three challenging months, coronavirus-induced lockdowns have wreaked havoc on the U.S. and global economies. Millions have filed for unemployment benefits. COVID-19 infections appear to have peaked in many places, but the risk of secondary outbreaks remain. Meanwhile, widespread civil unrest in many American cities has added a volatile new element to an already high level of uncertainty.
Despite all of this, many stocks are down on a year-to-date basis but not necessarily out as many investors optimistically look ahead to an eventual recovery. Their hopes are underpinned by massive government stimulus measures and ultra-low interest rates. Some companies perceived to be benefiting from stay-at-home mandates — including e-commerce, video streaming and food delivery firms — have rallied in the face of the worst market and economic environment since the 2008–09 global financial crisis.
As Capital Group vice chairman and portfolio manager Rob Lovelace has noted in recent investors calls, there is a unique aspect of this downturn: It was self-imposed by governments in response to a global health crisis. As such, it is not difficult for investors to imagine an end to this chapter and look forward to a post-COVID recovery period, which may have already started.
“This is different than the 2008 financial crisis — we can see the other side of the valley,” says Lovelace, a portfolio manager with New Perspective Fund®.
.png)
“It’s hard to know how wide the valley is, but I believe we will end up in a better place two years from now.”
Positioning for a market recovery
Bear markets are painful, no doubt about it. And when you’re in the middle of a sharp decline like the one we saw in March, it feels like it’s never going to end. But it’s important to remember that during the post-World War II era, bull markets have been far more robust than bear markets, and they’ve lasted considerably longer as well.
While every market decline is unique, over the past 70 years the average bear market has lasted 14 months and resulted in an average loss of 33%. By contrast, the average bull market has run for 72 months — or more than five times longer — and the average gain has been 279%.
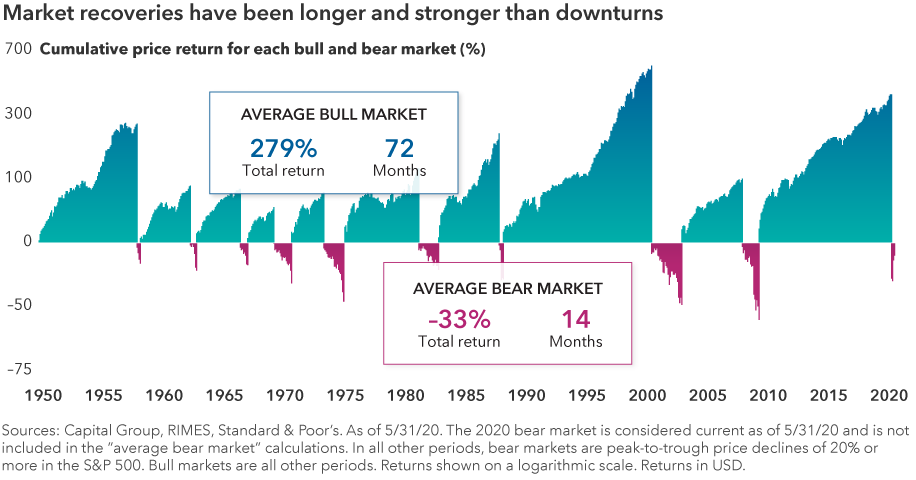
Moreover, returns have often been strongest right after the market bottoms, as investors learned in the last severe downturn. After the carnage of 2008, U.S. stocks finished 2009 with a 23% gain. Missing a bounce back can cost you a lot, which is why it’s important to consider staying invested through even the most difficult periods.
Dividends and the downturn
Another important difference in this downturn is that prospects for some dividend-paying stocks have changed dramatically. During previous bear markets, dividend stocks in aggregate have generally helped to provide a cushion against rapidly falling equity prices. Not so this year as many previously reliable dividend-paying companies have suspended or cut those payments in a bid to preserve capital.
However, rather than avoiding income stocks altogether, investors should instead consider the fundamental strengths and weaknesses of each company with an eye toward dividend sustainability going forward, notes Joyce Gordon, a portfolio manager with American Mutual Fund®.
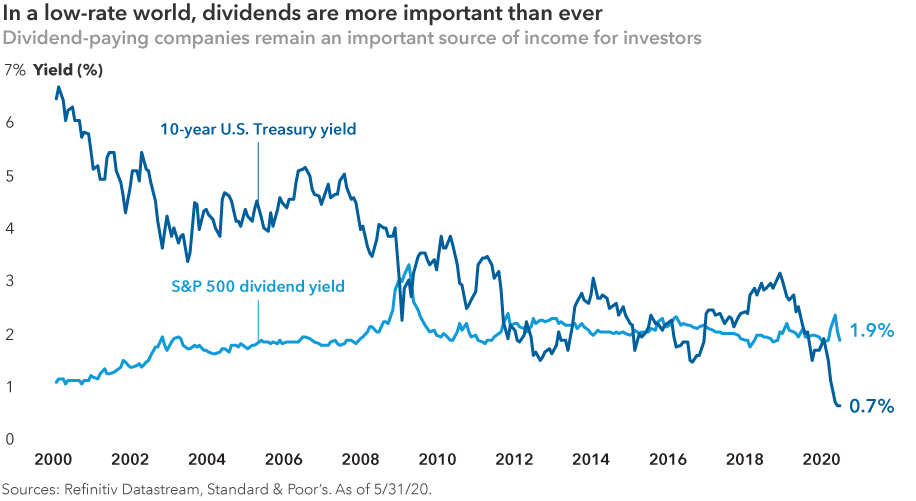
Indeed, select companies across various sectors — including Apple, Costco, Procter & Gamble and UnitedHealth — have actually increased their dividends this year. “The key is to be really selective in this environment,” Gordon says. “Not all dividend-payers are created equal. Companies with high debt levels and a deteriorating credit outlook are particularly unattractive, in my view.”
International outlook: Seek opportunities beyond borders
If you’re convinced that all the best stocks are in the U.S., then it’s time to take a closer look at the issue.
While it’s true that U.S. market indexes have generated greater returns than international indexes over the past decade, indexes don’t tell the whole story. In fact, on a company-by-company basis, the picture changes drastically: The stocks with the best annual returns have been overwhelmingly located in non-U.S. markets.
That trend was even more pronounced in the first quarter of 2020. The list of investable companies with the best returns was dominated by Chinese firms. Not surprising, given that China was the first country to get hit by the COVID-19 outbreak, and among the first to emerge from lockdown. While one quarter is a very short time frame, the trend has broadly played out over other years as well through generally smaller non-U.S. companies in fast-growing emerging markets.
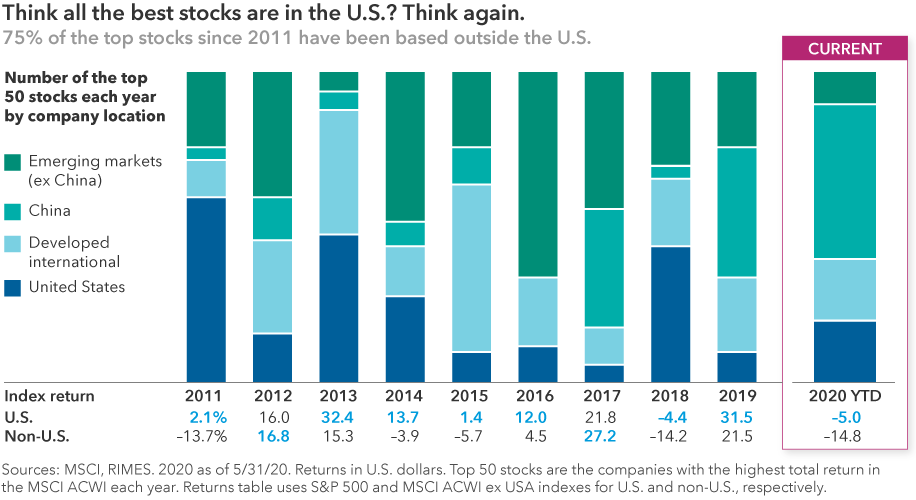
Why? It’s all about opportunity set. There are roughly three times as many foreign stocks as domestic. So why fish in a smaller pond when there are great companies all over the world? When markets are uncertain, it’s important to have flexibility. Consider selecting global funds that give managers the ability to choose from among the best companies, no matter where they are located.
Fixed income outlook: Focus on core strength
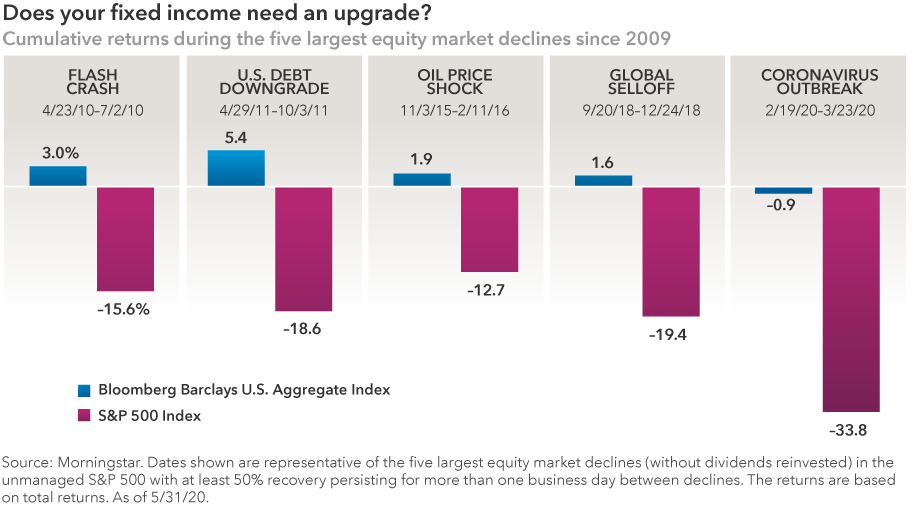
Stock market turmoil has hammered home one crucial lesson: the importance of high-quality bonds in a diversified portfolio. If you owned a core bond fund that provided capital preservation and diversification from equities when the stock market plummeted in the first quarter, then you probably feel pretty good about your decision.
From peak to trough, equities fell more than 30%, while core bond fund returns — as measured by the Bloomberg Barclays U.S. Aggregate Index — were close to flat. By contrast, many widely used funds in the core plus and multisector bond categories, which often rely more heavily on higher risk bonds, failed to perform these critical roles and investment returns suffered.
“We talk all the time about the four roles of fixed income in a balanced portfolio. They are diversification from equities, income, inflation protection and capital preservation,” explains Mike Gitlin, Capital Group’s head of fixed income. “There is no fifth role for replicating equity risk across your entire bond portfolio. We believe investors should take measured risks in their equity portfolios and dedicate a large portion of their bond portfolios to those four very important roles.”
If you didn’t follow that approach, you might think it’s too late to upgrade your bond portfolio. It isn’t, Gitlin notes. Even though government bond yields have fallen sharply, the market expects them to remain low. Easy monetary policy, low growth and near-term muted inflation prospects imply that significantly higher rates aren’t a major risk today.
Get more insights for the rest of 2020
Four actions to take in bond portfolios
International markets on the comeback trail
The potential shock absorption that a quality-oriented core bond fund can provide still matters. Stock market volatility may not be over. While many investors expect the global economy to recover eventually, the timing isn’t certain and, therefore, a solid dose of downside protection remains a vital part of any fixed income allocation.
Standard & Poor’s 500 Composite Index is a market capitalization-weighted index based on the results of approximately 500 widely held common stocks.
MSCI ACWI is a free float-adjusted market capitalization-weighted index that is designed to measure equity market results in the global developed and emerging markets, consisting of more than 40 developed and emerging market country indexes. MSCI World ex USA Index is designed to measure equity market results of developed markets. The index consists of more than 20 developed market country indexes, excluding the United States.
Bloomberg Barclays U.S. Aggregate Index represents the U.S. investment-grade fixed-rate bond market.
The Morningstar Intermediate Core Bond Category Average contains portfolios that invest primarily in investment-grade U.S. fixed-income issues and hold less than 5% in below investment-grade exposures. The Core-Plus category contains portfolios that invest primarily in investment-grade U.S. fixed-income issues but have greater flexibility than core offerings to hold non-core sectors such as corporate high yield, bank loan, emerging markets debt and non-U.S. currency exposures. The Multisector Bond category contains portfolios that seek income by diversifying their assets among several fixed income sectors, usually U.S. government obligations, U.S. corporate bonds, foreign bonds and high-yield U.S. debt securities.
The market indexes are unmanaged and, therefore, have no expenses. Investors cannot invest directly in an index.
Investing outside the United States involves risks, such as currency fluctuations, periods of illiquidity and price volatility, as more fully described in the prospectus. These risks may be heightened in connection with investments in developing countries. Small-company stocks entail additional risks, and they can fluctuate in price more than larger company stocks.
The return of principal for bond funds and for funds with significant underlying bond holdings is not guaranteed. Fund shares are subject to the same interest rate, inflation and credit risks associated with the underlying bond holdings. Investments in mortgage-related securities involve additional risks, such as prepayment risk, as more fully described in the prospectus. Higher yielding, higher risk bonds can fluctuate in price more than investment-grade bonds, so investors should maintain a long-term perspective. Bond ratings, which typically range from AAA/Aaa (highest) to D (lowest), are assigned by credit rating agencies such as Standard & Poor's, Moody's and/or Fitch, as an indication of an issuer's creditworthiness. If agency ratings differ, the security will be considered to have received the lowest of those ratings, consistent with the fund's investment policies. Securities in the Unrated category have not been rated by a rating agency; however, the investment adviser performs its own credit analysis and assigns comparable ratings that are used for compliance with fund investment policies.
Bloomberg® is a trademark of Bloomberg Finance L.P. (collectively with its affiliates, “Bloomberg”). Barclays® is a trademark of Barclays Bank Plc (collectively with its affiliates, “Barclays”), used under license. Neither Bloomberg nor Barclays approves or endorses this material, guarantees the accuracy or completeness of any information herein and, to the maximum extent allowed by law, neither shall have any liability or responsibility for injury or damages arising in connection therewith.
MSCI has not approved, reviewed or produced this report, makes no express or implied warranties or representations and is not liable whatsoever for any data in the report. You may not redistribute the MSCI data or use it as a basis for other indices or investment products.
© 2020 Morningstar, Inc. All rights reserved. The information contained herein: (1) is proprietary to Morningstar and/or its content providers; (2) may not be copied or distributed; and (3) is not warranted to be accurate, complete or timely. Neither Morningstar nor its content providers are responsible for any damages or losses arising from any use of this information. Past performance is no guarantee of future results.
Standard & Poor’s 500 Composite Index is a product of S&P Dow Jones Indices LLC and/or its affiliates and has been licensed for use by Capital Group. Copyright © 2020 S&P Dow Jones Indices LLC, a division of S&P Global, and/or its affiliates. All rights reserved. Redistribution or reproduction in whole or in part are prohibited without written permission of S&P Dow Jones Indices LLC.
Never miss an insight
The Capital Ideas newsletter delivers weekly insights straight to your inbox.
Statements attributed to an individual represent the opinions of that individual as of the date published and do not necessarily reflect the opinions of Capital Group or its affiliates. This information is intended to highlight issues and should not be considered advice, an endorsement or a recommendation.
 Rob Lovelace
 Joyce Gordon
 Mike Gitlin