U.S. equities

Sizing up small- and mid-cap stocks in concentrated U.S. market

There was a time when the Magnificent Seven weren’t so magnificent. They were far smaller companies in terms of market value, and each faced its own difficulties. Apple flirted with bankruptcy, Amazon toiled to find the right formula for its fulfillment centers, while Tesla struggled to produce enough electric vehicles. They didn’t become trillion-dollar companies overnight. That’s what we find exciting when searching for investments among U.S. small- to mid-sized (SMID) companies valued from $2 billion to $50 billion.


The breadth and depth of opportunities is vast. It’s truly a stock pickers market, with more than 2,000 companies in the U.S. to consider. We find the SMID landscape less thematic than the large-cap space, where stocks have been driven by well-recognized trends, such as artificial intelligence or weight loss drugs. There are multiple avenues to pursue solid long-term investments: You can find companies with promising technology platforms, firms undergoing structural turnarounds, or even less glamorous entities that grow earnings at steady rates and pay consistent dividends.


With lingering questions about a concentrated U.S. equity market, we believe small- and-mid-cap companies offer a range of opportunities and may benefit if market sentiment shifts in new directions. Here’s why we find this area of the equity market attractive, barring some of its risks. We also share our investment approach and catalysts that could drive a rotation.

A place to find companies that can become much bigger

A primary attraction to investing in small- and mid-cap companies is the potential for significant growth in market capitalization. The investment teams at Capital Group refer to this as looking for companies that might grow from “acorns to oaks.” Think of it this way: There is more potential for a $10 billion company with the right business plan and management team to grow into a $100 billion market cap. It’s likely more difficult for a $1 trillion company to go to $10 trillion — that would mean the company would account for roughly 16% of the U.S. stock market’s total market capitalization.


Investors should also be aware that stocks of SMID companies entail additional risks and can be more volatile than stocks of larger cap companies, so a long term view is necessary. 


Companies such as Netflix and Tesla are examples of small-cap companies that grew larger in value over time. But not all can make the leap, underscoring the need for rigorous research.


Quality varies across the small-cap universe. Profitability can ebb and flow, depending on the strength of the U.S. economy and the level of interest rates, among other factors. As of September 30, about 42% of companies in the Russell 2000 Index (small-cap benchmark) were unprofitable versus 14% of companies in the Russell Midcap Index and 6% for the S&P 500 Index. Finding the right companies makes a difference as the chart shows, and having a sharp research edge helps. 

Break on through

The table illustrates the total number of companies that graduated from the small-cap benchmark Russell 2000 Index to Russell Midcap Index from 2014 to 2023. It consists of the total 1,993 companies, out of which 152 companies made a leap in an average time of 4.4 years with 13.1% average annualized 10-years returns. The number of companies that stayed in the Russell 2000 are 825 with 3.7% average annualized 10-years returns.

Source: Capital Group. Data reflects December 31, 2014, to December 31, 2023.

Mid-cap companies often have fewer Wall Street analysts covering their businesses than larger companies or may not have any sell-side research coverage. Wall Street banks pivoted from covering SMID companies in the wake of the 2003 settlement with regulators over conflicts of interest. It’s resulted in opportunities for stock pickers with deep industry knowledge and extensive corporate networks. At Capital Group, for instance, we have 24 investment analysts dedicated to small- and mid-sized companies. We believe less coverage of certain stocks by Wall Street sell-side analysts helps us find stocks that may be mispriced in the market or opportunities that are not widely apparent.

Sell-side research coverage is more focused on large caps

chart-GK-analyst-Coverage-916x

Source: Factset. Data as of January 28, 2025.

Valuation disparity may drive rotation into small and midcaps

Valuations for large caps are high. In contrast, the MSCI USA Mid Cap Index (a benchmark for mid-sized companies) trades at a 20-year low relative to the MSCI USA Large Cap Index at a 20% discount.


Given the dominance of large-cap U.S. equities for many years over other equity asset classes, a pervading question for investors has been whether a rotation in equity markets will happen and when. The S&P 500 returned more than 20% in 2023 and 2024, marking the only time since 1998 the index has posted that level of returns in back-to-back years.


For the large and megacap stocks, there is little room for error in our view. Expectations for some of the larger companies that helped boost the S&P 500’s return over the last few years are high, and slight misses on earnings expectations may drive stock prices down. A possible outcome could be revived interest in small- and mid-cap stocks as part of a broader market rotation.

A discount not seen since 2003

chart-GK-mid-cap-relative-valuation_large-caps-916x

Source: Factset.  P/E = price-to-earnings. NTM = next twelve months. The y-axis represents the ratio between the P/E of MSCI USA Mid Cap Index and the P/E of the MSCI USA Large Cap Index. Data as of December 31, 2024. 

IPOs could heat up as companies exit private equity space

After a recent slowdown in IPO and merger and acquisition (M&A) activity, there is pent-up demand from private equity (PE) investors to monetize their investments. Historically, we have found that when the IPO market starts to rebound, higher quality companies with smartly run businesses and prospects are often the first brought to market.


Since the early 2000s, the number of smaller and mid-sized firms going public has declined. Companies have been staying private longer via private equity and venture capital funding or through acquisition by larger companies before going public. Now with a decade-long period of near-zero interest rates over, that dynamic could change. If private equity companies monetize some of their holdings, we could see new entrants to the market.


M&A activity could bolster sentiment for mid-cap companies. The Trump administration is anticipated to deregulate and less stringently block transactions on antitrust grounds, potentially paving the way for dealmaking in the mid-cap space.

Robust U.S. economy is friendly turf for SMID

Hopes for the growth of the U.S. economy, compared with Europe or China, could bolster sentiment depending on how proposed tariffs shakeout. SMID, given its sizable universe of industrial and financial companies, typically is a procyclical asset class that does better in periods of U.S. business expansion, normal interest rates and modest inflation.


Our economists believe the U.S. economy is shifting back to mid-cycle, rather than exhibiting late-cycle conditions, which often foreshadow a recession. A mid-cycle economy is generally characterized by rising corporate profits, accelerating credit demand, softening cost pressures and a shift toward neutral monetary policy.


Small business confidence is improving with the strength of the U.S. economy and less pressure on corporate balance sheets from higher interest rates. Along those lines, the NFIB (National Federation of Independent Business) Small Business Optimism Index saw a notable rise and sustained increase during the previous Trump presidency. Smaller companies, which generate more of their revenue domestically, are likely to be more insulated from the impact of proposed tariffs. For example, companies in the Russell 2500 Index generated 76% of their revenue within the United States (as of December 31, 2024) versus 58% for S&P 500 companies.


The U.S. consumer remains robust, which should underpin demand and provide the customer base for these companies. On the flipside, as companies can import components from China and other countries, some of their cost base could be subject to tariffs, pressuring profit margins.

A core investment approach for a vast hunting ground

SMID is an idiosyncratic universe, not overly dominated by any particular set of long-term trends. It’s also less concentrated in terms of the top company weights in the benchmark and offers more sector diversification, compared with the large-cap universe.


The SMID space is fertile ground for well-run companies that may not be popular with investors. The heaviest sector weights in the benchmark Russell 2500 or S&P 400 indices are industrials and financials, not the more cutting-edge information technology or consumer discretionary sectors.


We believe there are several routes to locating successful investments, making it ideal for blending both growth- and value-oriented approaches to construct a well-rounded portfolio. For instance, we seek a combination of fast-growing companies, turnarounds or special situations, fallen angels (a stock that has declined sharply from its all-time highs) and steady growers. Even within sectors, the choices are vast.


Take financials, where our investments range from companies trading at book value (less expensive) to those trading at eight times book (more expensive). In our portfolios, we own consumer finance platforms in the quickly expanding “buy now, pay later” market, to small asset managers benefiting from retail demand for alternative investments, to regional banks geographically well-positioned for loan growth, to niche insurance companies with strong pricing power.

SMID offers different opportunities than large cap

chart-GK-why-the-mid-cap-space-is-attractive-916x

Source: Capital Group. Data as of December 31, 2024.

Industrials is another sector with diverse opportunities.


There are companies, such as Comfort Systems, a supplier of heating, ventilation and air conditioning systems, profiting from the explosive growth of data centers for AI and new semiconductor manufacturing plants. There are opportunities to invest in established industrials like Ingersoll-Rand, who are proven capital allocators, making acquisitions to grow revenue while also paying steady dividends. Then there are companies in attractive businesses that have been hit by a cyclical downturn, such as Generac, which makes portable generators for consumers.


The market can also get too negative on established mid-cap companies, creating occasions to buy stocks that get mispriced. In the past six months, we used this as a buying opportunity for name-brand auto and health care pharmacy companies.

Bottom line

Investing is SMIDs offers an opportunity to find companies that can grow much larger over time and the potential to invest in less researched companies that may not be understood by the broader market. By focusing on thorough research, identifying strong management teams and emerging trends not fully recognized by the broader market, it’s possible to find companies with strong prospects for capital appreciation.


No doubt challenges loom. The impact of tariffs may slow U.S. economic growth, reigniting concerns about higher interest rates and a potential recession, which would likely drive market volatility and spur investors to seek shelter in asset classes perceived to be less volatile.


Returns for small- and mid-cap companies have lagged large caps for more than 20 years due to the cyclical nature of the asset class. So even if a strong market rotation occurs, a long-term horizon may be necessary to realize sustained equity price appreciation.

roz-hongsaranagon-color-600x600

Roz Hongsaranagon is an equity portfolio manager with 22 years of investment industry experience (as of 12/31/2024). She holds a bachelor’s degree in international relations & economics from Brown University.

matt-hochstetler-600x600

Matt Hochstetler is an equity portfolio manager with 20 years of investment industry experience (as of 12/31/2024). He holds an MBA from Harvard and a bachelor’s degree in international finance and economics from Georgetown University. 

kent-chan-color-600x600-new

Kent Chan is an equity investment director with 33 years of investment industry experience (as of 12/31/2024). He holds a bachelor’s degree in political economics from the University of California, Berkeley.

Past results are not predictive of results in future periods.


The NFIB Small Business Optimism Index is a composite of ten seasonally adjusted components. It is a monthly index that measures the health of small businesses in the U.S. based on a survey of NFIB members.


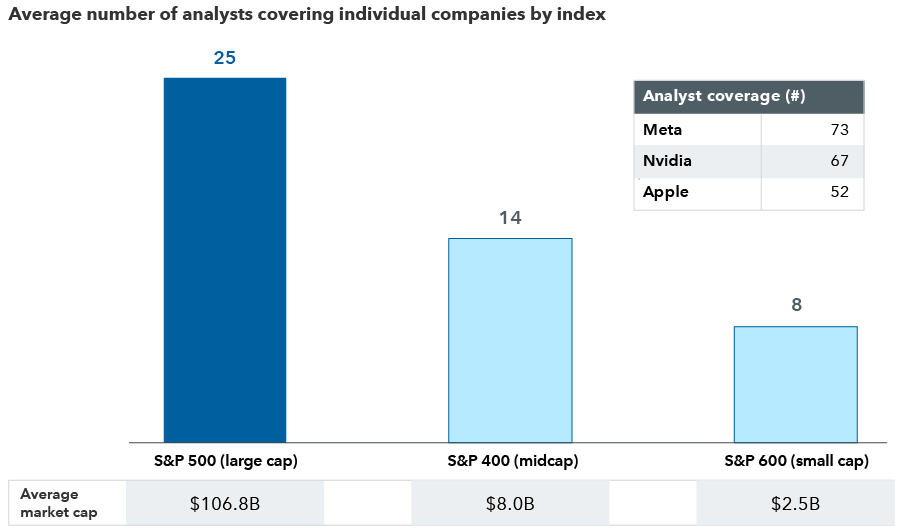
The Magnificent Seven refers to the seven largest weights in the S&P 500 that have played a crucial role in driving the market's growth. The companies are Alphabet, Amazon, Apple, Meta Platforms, Microsoft, NVIDIA and Tesla.


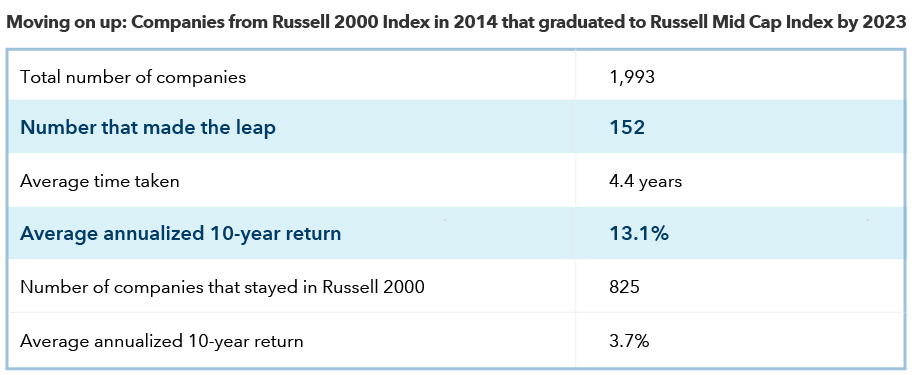
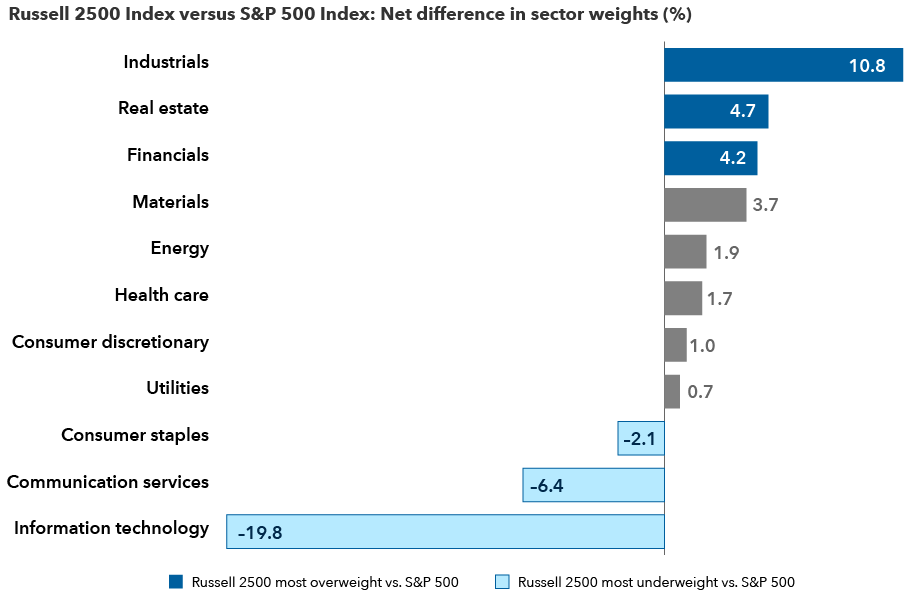
The Russell 2000® Index measures the performance of the small-cap segment of the US equity universe. The Russell 2000 Index is a subset of the Russell 3000® Index representing approximately 7% of the total market capitalization of that index, as of the most recent reconstitution. It includes approximately 2,000 of the smallest securities based on a combination of their market cap and current index membership.


The S&P 500 Index is a market-capitalization-weighted index based on the results of approximately 500 widely held common stocks.


The Russell Midcap® Index measures the performance of the mid-cap segment of the US equity universe. The Russell Midcap Index is a subset of the Russell 1000® Index. It includes approximately 800 securities.


The S&P MidCap 400® is a benchmark for mid-sized companies. The index, which is distinct from the large-cap S&P 500®, is designed to measure the performance of 400 mid-sized companies, reflecting the distinctive risk and return characteristics of this market segment.


The S&P SmallCap 600® seeks to measure the small-cap segment of the U.S. equity market. The index is designed to track companies that meet specific inclusion criteria to ensure that they are liquid and financially viable.


London Stock Exchange Group plc and its group undertakings (collectively, the “LSE Group”). © LSE Group 2023. FTSE Russell is a trading name of certain of the LSE Group companies. FTSE® and Russell® indexes are trademarks of the relevant LSE Group companies and are used by any other LSE Group company under license. All rights in the FTSE Russell indexes or data vest in the relevant LSE Group company which owns the index or the data. Neither LSE Group nor its licensors accept any liability for any errors or omissions in the indexes or data and no party may rely on any indexes or data contained in this communication. No further distribution of data from the LSE Group is permitted without the relevant LSE Group company’s express written consent. The LSE Group does not promote, sponsor or endorse the content of this communication.


Each S&P Index ("Index") shown is a product of S&P Dow Jones Indices LLC and/or its affiliates and has been licensed for use by Capital Group. Copyright © 2025 S&P Dow Jones Indices LLC, a division of S&P Global, and/or its affiliates. All rights reserved. Redistribution or reproduction in whole or in part is prohibited without written permission of S&P Dow Jones Indices LLC.


Investments are not FDIC-insured, nor are they deposits of or guaranteed by a bank or any other entity, so they may lose value.
Investors should carefully consider investment objectives, risks, charges and expenses. This and other important information is contained in the fund prospectuses and summary prospectuses, which can be obtained from a financial professional and should be read carefully before investing.
Small-company stocks entail additional risks, and they can fluctuate in price more than larger company stocks.
The indexes are unmanaged and, therefore, have no expenses. Investors cannot invest directly in an index.
MSCI has not approved, reviewed or produced this report, makes no express or implied warranties or representations and is not liable whatsoever for any data in the report. You may not redistribute the MSCI data or use it as a basis for other indices or investment products.
FTSE/Russell indexes: London Stock Exchange Group plc and its group undertakings (collectively, the “LSE Group”). © LSE Group 2025. FTSE Russell is a trading name of certain of the LSE Group companies. FTSE indexes are trademarks of the relevant LSE Group companies and are used by any other LSE Group company under license. All rights in the FTSE Russell indexes or data vest in the relevant LSE Group company which owns the index or the data. Neither LSE Group nor its licensors accept any liability for any errors or omissions in the indexes or data and no party may rely on any indexes or data contained in this communication. No further distribution of data from the LSE Group is permitted without the relevant LSE Group company's express written consent. The LSE Group does not promote, sponsor or endorse the content of this communication.
Statements attributed to an individual represent the opinions of that individual as of the date published and do not necessarily reflect the opinions of Capital Group or its affiliates. This information is intended to highlight issues and should not be considered advice, an endorsement or a recommendation.
All Capital Group trademarks mentioned are owned by The Capital Group Companies, Inc., an affiliated company or fund. All other company and product names mentioned are the property of their respective companies.
Use of this website is intended for U.S. residents only. Use of this website and materials is also subject to approval by your home office.
Capital Client Group, Inc.
This content, developed by Capital Group, home of American Funds, should not be used as a primary basis for investment decisions and is not intended to serve as impartial investment or fiduciary advice.