Economic indicators

Beyond consensus: Economic perspectives for 2025

As we begin 2025, our team of economists highlights areas where their outlook is a bit different from consensus.


While markets were confident inflation was tamed last year, pockets of rising prices could appear near-term as investors digest uncertainty around trade and fiscal policy under the new presidential administration. Still, U.S. economic strength remains front-and-center, carrying global growth. Areas such as Europe and China face ongoing growth hurdles, coupled with potential tariffs and a strong dollar. We estimate interest rates could remain high, though may settle around 4%. However, the U.S. Federal Reserve will have to weigh any potential impacts of tariffs. Above all, we’ll be eyeing any signals that the economy is slowing. 


Below, our economists in Capital Strategy Research (CSR) offer detailed insights into the key themes they are watching this year and potential gaps in consensus thinking.

U.S. growth to reaccelerate despite higher inflation and rates 

It is widely acknowledged that new policy from the incoming administration will play a significant role in the U.S. outlook, though the exact impact remains uncertain. While consensus views on the strength of the economy have narrow divergences, they nonetheless tell slightly different stories. “Our outlook for U.S. growth is more optimistic than the consensus, with expectations of higher inflation and higher rates,” U.S. economist Jared Franz said. The consensus on real GDP growth for 2025 is slowing to a modest, yet still positive pace. Our economists forecast a reacceleration, predicting a GDP growth rate of 2.7% for 2025 and between 2% and 2.5% for 2026. "The drivers for this growth continue to be strong productivity in the U.S., consumer spending, and business investment," Franz said.

U.S. growth is set to outpace peers

The line chart depicts real GDP from 1996 to 2024 for the U.S., U.K., Germany, France, Italy and the eurozone, indexed at 100.  The U.S. experienced the highest rate of growth in real GDP for the period, starting at the lowest on the chart around 85 in 1995 and steadily rising near 180 by 2024. The next highest was the U.K. starting slightly higher than the U.S. near 85 in 1995 and rising to near 150 in 2024. France, Germany and the eurozone, which they are both members of, all rose from near 90 in 1995 to near 120 in 2024. Italy, which is also a member state of the Eurozone, showed the weakest economic performance, starting highest in real GDP near 100 in 1995 and rising the slowest, and experience the longest period of decline following the 2008 global financial crisis, ending near 110 by 2024.

Source: AMECO database. Based on an index of growth (1999= 100). Data as of November 31, 2024.

There is a broad agreement that the rise in the unemployment rate in 2024 has been supply-led, and Wall Street firms broadly anticipate a continued slowdown in jobs and hiring with waning demand. With these outlooks, it’s unsurprising firms expect consumer spending to decelerate. However, our analysis suggests the unemployment rate should be falling, not rising, owing in part to the strength of corporate earnings and continued investment, and that real income growth should continue to support consumer spending growth.

“We have been highlighting the risks to continued progress on inflation, irrespective of the policy outlook. We predict core personal consumption expenditures inflation in the range of 2.5% to 3.0% in 2025 and 2026, with the risk from policy being tilted toward pushing it higher rather than lower,” economist Darrell Spence says. “The resilience of the U.S. economy, even in the face of higher interest rates, has been one of the biggest surprises of the past several years, and that strength could make further progress on inflation difficult.”


Due to the significant uncertainty surrounding the tariff regime, the Fed is likely to adopt a wait-and-see approach.


“It remains unclear how the Fed would respond to tariffs; they might overlook tariff-driven inflation and refrain from raising rates, or they could cut rates if tariffs significantly weaken economic activity,” Spence said. “For now, our expectation is that the federal funds rate will find a floor not much below where it is currently.”

Yields may remain elevated on policy uncertainty

The line chart compares the federal funds future rate to the 10-year U.S. Treasury yield from September 30, 2021, to January 14, 2025. Both the rate and the yield track closely over the period, though the fed funds future rate experience slightly steeper declines and has not risen as high as the 10-year Treasury yield since 2024. From 2021 to early 2023 both figures rose above 5.0 with dips in mid-2022.

Sources: U.S. Federal Reserve, CME Group. Data as of January 14, 2025. 

Market consensus is now more closely aligned with CSR’s perspective on rates. Federal funds futures are showing just over one cut before year-end 2025, so a 10-year bond yield between 4.5% and 5.0% is probably “appropriate.”  However, should policy changes lead to concerns about the federal government’s fiscal situation, a 10-year Treasury yield between 5.5% to 6.0% may not be out of the question.


Lastly, consensus estimates continue to call for a strong U.S. dollar as looser fiscal policies and deregulation, alongside continued U.S. leadership in the technology space drive strong cyclical growth in the first half of 2025. “I am staying tactically bullish on the dollar in 2025,” notes currency analyst Jens Sondergaard. “But I am watching for signs of a narrowing of the gap between U.S. economic outperformance, which would remove a key dollar supportive factor, possibly in the second half of 2025.” 

Europe warrants caution amid growth challenges  

Market consensus for Europe in 2025 is cautious, with expectations of a modest pick-up in growth after subdued growth in 2023 and 2024, a gradual easing of inflation toward or below central banks’ 2% target, and policy interest rates to fall by 100 basis points (bps) in both the eurozone and the U.K. There is a concern that higher U.S. tariffs could undermine European economic growth.


“On inflation, market consensus expectations are for softer labor markets and tighter fiscal policy to pull down services inflation,” suggests Europe economist Robert Lind. “We are more cautious on the potential drop in inflation. Inflation could be slower to return to central banks’ 2% targets.”


The resilience of services inflation so far has confounded expectations. Despite clearer signs that the labor market is softening, there is yet to be strong evidence that wage growth is returning to levels consistent with 2% inflation. A reversal in core goods disinflation – perhaps prompted by higher tariffs – could mean progress on inflation stalls or even reverses. 


“The challenge for Europe’s central banks will be how to weigh sluggish growth against stickier inflation. We think they are likely to focus on growth weakness to justify rate cuts in early 2025, but inflation worries will constrain the scope of easing later in the year,” says economist Beth Beckett.


Beckett is also keeping a close eye on the U.K., where households are consuming fewer goods than they did in 2019 and at the same time paying higher prices for them. “While shifts in demand during the pandemic explain some of this, trade barriers resulting from Brexit are also having long-term negative impacts on consumption and prices,” Beckett said. “Higher goods prices are likely to complicate the Bank of England’s efforts to return inflation to their 2% target on a sustainable basis, especially considering stubborn services-sector inflation.” In addition, investors are becoming more nervous about the U.K.’s fiscal trajectory, which has triggered higher bond yields and a weaker pound.


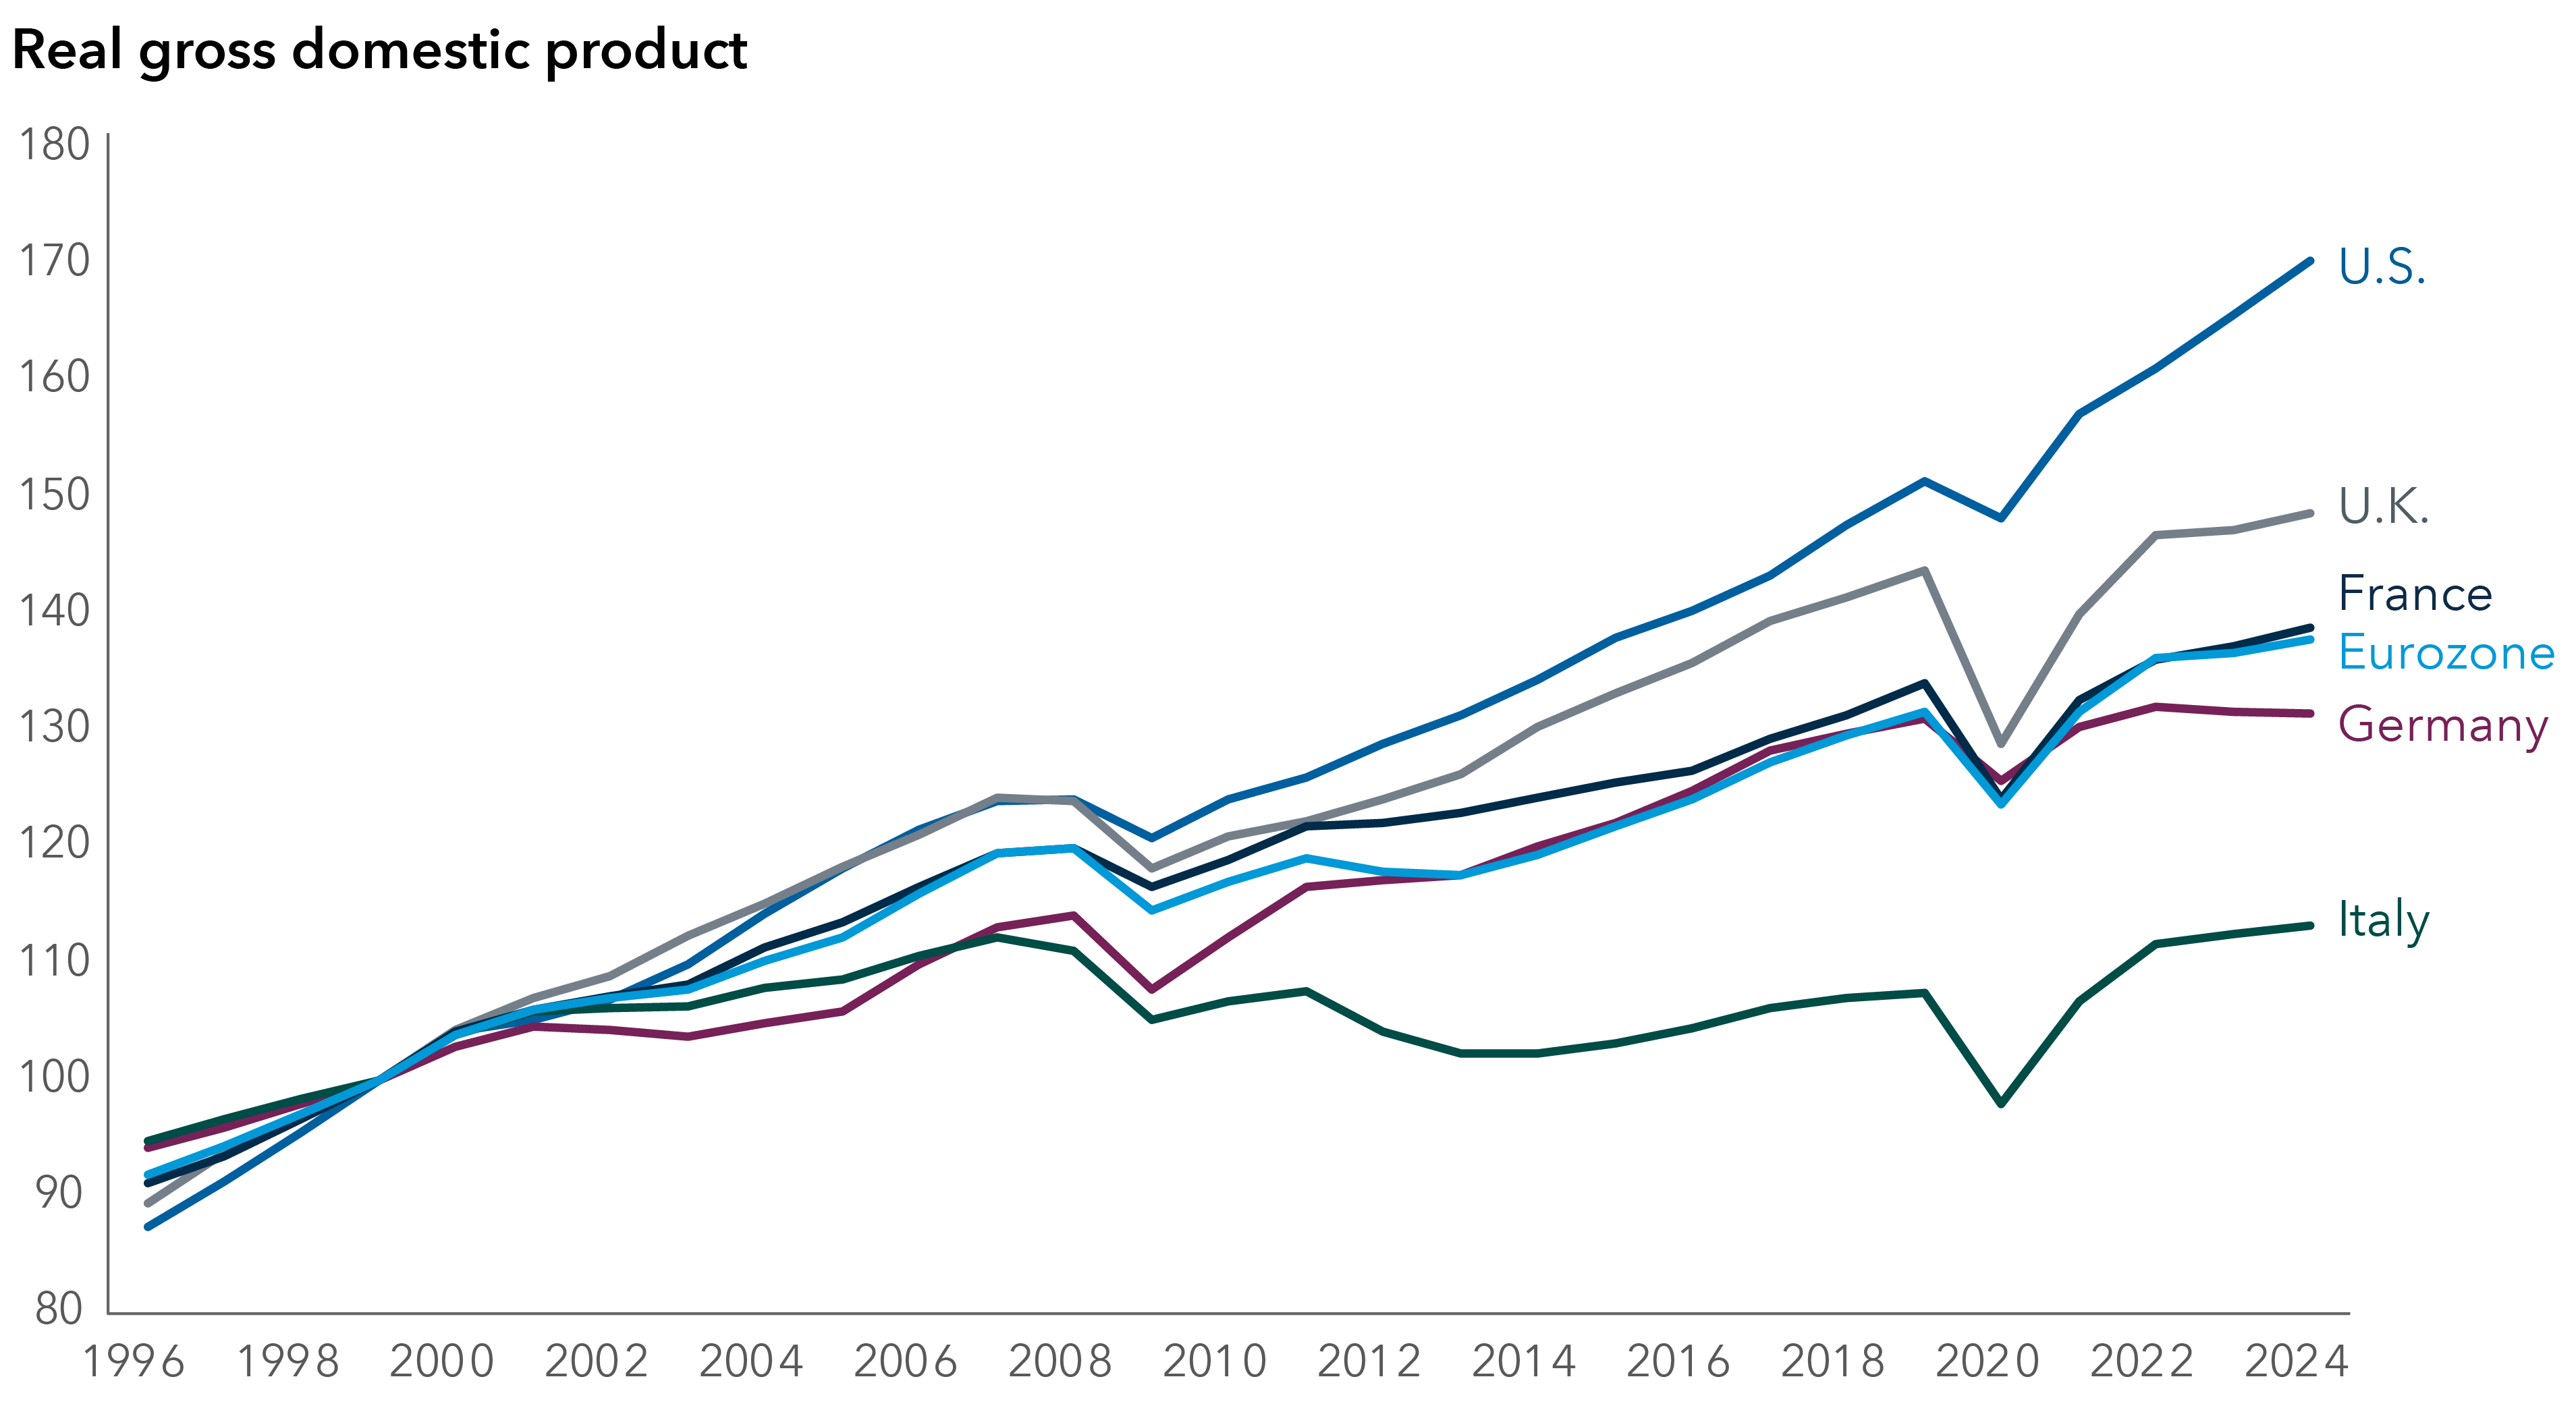
Moreover, risks to equity market forecasts are asymmetric. “The sentiment and valuation gap between the U.S. and European markets appears stretched,” Lind said. “We think there is greater potential for European equity returns to catch up with the U.S., either in a ‘risk-off’ drawdown in U.S. equities or on a rotation into cheaper European equities.” 

Japan’s rates may rise but longer-term picture is intact 

“Consensus has caught up with my positive near-term view on Japan,” says Anne Vandenabeele, a Capital Group economist. “However, rates could rise more than consensus expects. I could see 0.75% to 1% policy rates in 2025. Without large or permanent tariffs, growth and inflation will probably be in line with or a bit higher than consensus in 2025 as well.”


The impact of tariffs remains an open question, setting up a potentially bumpy start to the year as markets speculate about Fed action and its implications for potentially weakening the yen. The consensus view on Japan calls for moderate reflation in 2025, with real wage gains, some rebound in domestic demand and inflation gently slowing to, or a bit below the Bank of Japan’s 2.0% target. 


“I’m more positive long term and could see a scenario where rates rise to 1.5% in 2026. Stronger growth in the U.S., as our U.S. economists are suggesting, or growth in Europe could lift Japanese growth and push the rate path a bit higher, as could additional stimulus in China,” highlights Vandenabeele. 


Negotiated and actual wage growth could surprise to the upside given ongoing labor shortages in Japan and going by some company announcements, which would be positive for households. The increase in the tax-free household income threshold is likely to pass, and its impact could be larger than the estimated +0.4 percentage points of GDP, given it is a permanent tax cut. 


Notwithstanding the more positive outlook for Japan, investors have also expressed worries about the potential for negative growth surprises, especially in the U.S. or China, especially if the 60%/10% tariffs by the U.S. on China or the rest of the world are implemented, negatively impacting Japan’s exports. 

Canada is poised for continued rate cuts 

While the resignation of Prime Minister Justin Trudeau has given a temporary sentiment boost to markets in the hope of potential economic and policy improvement, uncertainty remains, according to economist Tryggvi Gudmundsson. “Nobody is attempting to paint a pretty picture for Canada in 2025,” he said. “I think we’re likely to see more cuts than what analysts are expecting. I think the Bank of Canada will be reluctant to ease further following the next one or two cuts but will have no choice with the weak macro environment.”


Strong immigration in recent years has masked the fact that per capita growth has contracted. Private consumption has been weak, and investment subdued, so investors expect growth of around 2% in 2025. Gudmundsson highlights, “The main risks to that expectation are if the slowdown in immigration tightens the labor market materially, if there is a big shift in the policy agenda domestically or, if there’s an unexpected upturn in global growth.”

China’s growth prospects remain weak 

Compared to the previous two years, market consensus has become more cautious. While much remains to be seen on the impact of U.S. tariffs, the consensus among many analysts is slower growth in 2025 compared to 2024, ongoing deflationary pressures, a still-struggling housing market, and lower rates. Beijing is likely to target around 5% growth officially, but consensus suggests they will fall short. 


China affairs economist Stephen Green offers his perspective that “significant U.S. tariffs come and stay for at least 2025, Beijing’s stimulus will disappoint markets again, and China’s growth will remain weak. Exports have been one of the few growth drivers in 2024. And it looks like that will go away in 2025.”


With a more pessimistic consensus outlook on China, the chances of positive policy intervention are higher. But we think the downside risks outweigh the potential impact of a stimulus package from Beijing, or any negotiated deal between Beijing and Washington. 

India’s economy will likely manage to keep current growth rate  

India’s consensus economic outlook for 2025 is characterized by steady GDP growth anticipated to remain between 6% and 6.5%, with a focus on rate cuts and government capital expenditure driving economic activity, according to Indian affairs specialist Anirudha Dutta. “Given 5.4% GDP in the second quarter of fiscal year 2025, and with the new Reserve Bank of India governor, I anticipate the rate cutting cycle will start in February 2025, unless inflation moves higher,” Dutta said. 


Overall, the focus remains on containing inflation and holding the current account deficit and balance of payments in check while the government aims to reduce the fiscal deficit to 4.5% of GDP. Leading up to the various state elections in the second half of 2024, the Bharatiya Janata Party announced several cash transfer programs for women and socioeconomically challenged sections of the society. “This will likely weigh on the investment capacity of the state governments, while it may lead to some growth in rural consumption,” Dutta said. “The good news is that with the recent decline in stock prices, valuations for the Nifty 50 at a price-to-earnings ratio of 20 to fiscal year 2026 estimates are not too high given expectations of earnings growth in the low teens, although earnings estimates are still seeing downgrades.”

Emerging markets economies could be challenged by tariffs

Emerging markets are far from a monolith, with significant variation across regions, policy trajectories, and market opportunities in various countries. This diversity underscores the need to understand regions and countries’ unique economic drivers and policy challenges that will shape their economic outlook this year. 


In Latin America, growth is expected to be subdued and risks tilted to the downside. A lot of recent market attention has been on Brazil where fiscal concerns have put pressure on the country’s bonds and the currency. In Mexico, the country’s recent constitutional reforms and an untested fiscal agenda have also kept investors on edge. Immigration issues and trade tensions have added further pressure during a time of weak growth. That said, there is some excitement about prospects of U.S. companies moving manufacturing and other production facilities nearer to home in countries like Mexico. All in all, “the external environment could get challenging quickly if tariffs rise sharply and U.S, pressures mount for Mexico to change its trade relationship with China. That would put pressure on Latin American currencies, which would put central banks in a familiar but tough spot where they must choose between stabilizing the currency and supporting growth,” Gudmundsson said. 


Across the world, the impact from U.S. tariffs dominates Association of Southeast Asian Nations (ASEAN) consensus outlooks. Trade disruptions have the potential to hurt the region, leading to lower growth, disinflation, more rate cuts and weaker foreign exchange.  Furthermore, ASEAN markets have tended to perform poorly during periods of U.S. dollar strength. “I am more bullish than consensus on Malaysia,” says Capital Group Economist Chau Nguyen. “They could be well positioned to benefit from the secondary effects of Trump’s proposed tariffs. I am more worried about Indonesia, where higher for longer U.S. rates could stop Bank Indonesia easing, and places like Thailand, where political volatility and a lack of government stimulus could weigh on the outlook.” 

Emerging markets valuations have declined alongside growth expectations

The line chart features two y-axes with the left side showing the price-to-earnings differential, which is the MSCI Emerging Markets Index P/E divided by the MSCI World Index P/E (on a 12-month forward basis). The right axis of the chart shows the growth differential, which refers to the next two-year expected earnings-per-share growth of the MSCI EM Index minus the MSCI World Index. The data begins January 20, 2015 until January 8, 2025. The line chart shows that emerging market valuations have dropped over the last two years as the expected growth differential has been reduced.

Sources: Bloomberg, MSCI. Data as of January 8, 2025. The left y-axis shows the price-to-earnings differential, which is the MSCI Emerging Markets Index P/E divided by the MSCI World Index P/E (on a 12-month forward basis). The right y-axis of the chart shows the growth differential, which refers to the next two-year expected earnings-per-share growth of the MSCI EM Index minus the MSCI World Index. The P/E differential tracks the growth differential closely over the 10-year time frame shown.

Bottom line 

The global economic outlook for 2025 remains marked by questions around how new economic policies will affect the performance of the U.S., and the ripple effect of its policy decisions on the rest of the world. As the research from our team of economists highlights, navigating this environment will require close attention to both consensus and contrarian signals. 

JASF

Jared Franz is an economist with 19 years of investment industry experience (as of 12/31/2024). He holds a PhD in economics from the University of Illinois at Chicago and a bachelor’s degree in mathematics from Northwestern University.

beth-beckett-color-600x600

Beth Beckett is an economist with five years of industry experience (as of 12/31/2024). She holds a master's degree in economic history from the London School of Economics and Political Science and a bachelor's degree in economics from Durham University. 

ABV

Anne Vandenabeele is an economist with 24 years of investment industry experience (as of 12/31/2024). She holds a master’s degree with honors in economics from the University of Edinburgh and a Master of Philosophy in economics from the University of Oxford.

headshot-Anirudha-Dutta-AZD-600x600

Anirudha Dutta is a macro analyst with 29 years of investment industry experience (as of 12/31/2024). He holds a postgraduate diploma in business management from the Xavier School of Management and a bachelor’s degree with honors in metallurgical engineering from the Indian Institute of Technology, Kharagpur.

Individuals investing in developing markets should have a long-term perspective and be able to tolerate potentially sharp declines in the value of their investments.


The indexes are unmanaged and, therefore, have no expenses. Investors cannot invest directly in an index.


MSCI World Index captures large- and mid-cap representation across 23 developed markets countries.


The MSCI Emerging Markets Index captures large and mid cap representation across 24 Emerging Markets countries.


MSCI has not approved, reviewed or produced this report, makes no express or implied warranties or representations and is not liable whatsoever for any data in the report. You may not redistribute the MSCI data or use it as a basis for other indices or investment products.


The Nifty 50 represents the average of the top fifty Indian entities listed on the National Stock Exchange (NSE).


Investments are not FDIC-insured, nor are they deposits of or guaranteed by a bank or any other entity, so they may lose value.
Investors should carefully consider investment objectives, risks, charges and expenses. This and other important information is contained in the fund prospectuses and summary prospectuses, which can be obtained from a financial professional and should be read carefully before investing.
Investing in developing markets may be subject to additional risks, such as significant currency and price fluctuations, political instability, differing securities regulations and periods of illiquidity, which are detailed in the fund's prospectus. Investments in developing markets have been more volatile than investments in developed markets, reflecting the greater uncertainties of investing in less established economies. Individuals investing in developing markets should have a long-term perspective and be able to tolerate potentially sharp declines in the value of their investments.
Statements attributed to an individual represent the opinions of that individual as of the date published and do not necessarily reflect the opinions of Capital Group or its affiliates. This information is intended to highlight issues and should not be considered advice, an endorsement or a recommendation.
All Capital Group trademarks mentioned are owned by The Capital Group Companies, Inc., an affiliated company or fund. All other company and product names mentioned are the property of their respective companies.
Use of this website is intended for U.S. residents only. Use of this website and materials is also subject to approval by your home office.
Capital Client Group, Inc.
This content, developed by Capital Group, home of American Funds, should not be used as a primary basis for investment decisions and is not intended to serve as impartial investment or fiduciary advice.