Chart in Focus
Technology & Innovation
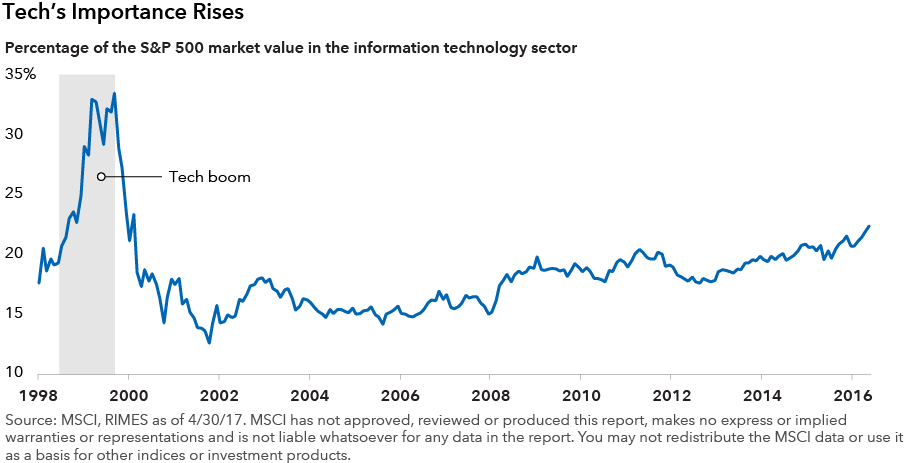
- Tech’s weighting in U.S. markets is the highest it’s been since the tech-stock boom.
- Valuations in tech are still compelling due to unique and powerful business models.
- Expect tech stocks’ sway to increase as platform companies grow and gain market share.
Surging technology stocks – think Facebook, Microsoft, Apple and Alphabet – are rapidly expanding their influence on the makeup and direction of the U.S. stock market. But while some might think this is a sign of excess or overvaluation, I suggest that, if anything, the sector’s influence will only intensify as the market appreciates these companies’ superior fundamentals and growth prospects.
There’s no denying tech stocks’ power. The market value weighting of information technology stocks in the Standard & Poor’s 500 Composite Index stood at 23% at the end of April 2017, the highest level since the tech-stock boom in 2000, when it peaked at 34% in August 2000. Tech’s outsized role is even more pronounced in emerging markets, accounting for 30% of the market value of the MSCI China Investable Market Index (IMI) as of 2016. That’s up from less than 10% in 2000. And technology is the largest component in the MSCI Emerging Markets Index.
Individual tech stocks tell the same story, too. Mobile device maker Apple saw its market value top $800 billion this year, the first U.S. company to reach that height — meaning this one stock accounts for 4% of the S&P 500’s market value. Overseas, Chinese internet giants Tencent and Alibaba are among the world’s 10 most valuable companies and some of the biggest drivers of returns over the past year, based on the MSCI ACWI index.
My analysis shows tech’s already large influence can grow even further, because:
1. I Believe This Isn’t the Tech Bubble
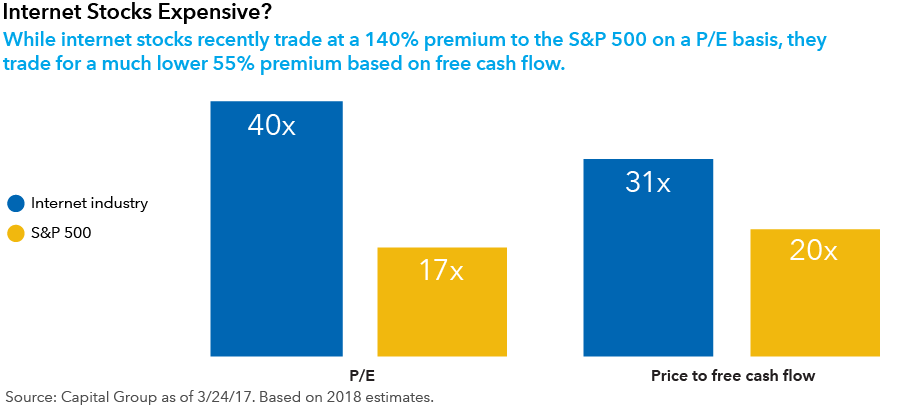
Despite strong gains this year, tech stocks, specifically those in the internet space, offer value. Internet stocks’ price-to-earnings multiples are 140% higher than that of the S&P 500 based on 2018 estimates, but that number masks a more accurate picture of the opportunity. Internet companies’ free cash flow gives a truer picture of their ongoing financial power, as these companies trade at just a 55% premium to the market in free cash flow estimates for 2018, a reasonable price in my view for superior profitability. Internet companies’ return on invested capital, a measure of how much profit is driven from equity and debt invested in the company, is 26% higher than that of the S&P 500. Internet companies also enjoy valuation support due to holding 4% of their market value in net cash, as opposed to S&P 500 companies that carry net debt.
2. The Internet Is Still Growing Rapidly
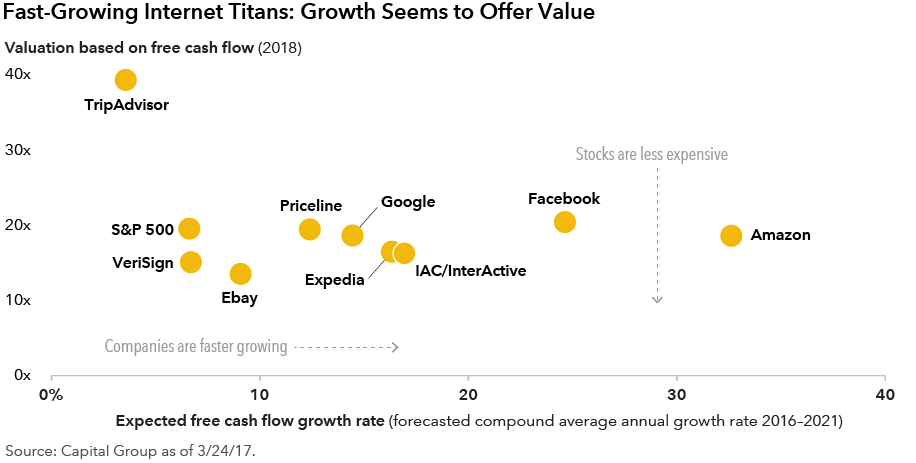
Growth abounds in tech: internet companies are expected to see their profits grow three times faster than the S&P 500 the next five years. Interestingly, the internet companies growing the fastest can be bought at attractive valuations. Amazon.com, for instance, is expected to post compound average annual growth of more than 30% between 2016 and 2021, which outstrips all of its major internet industry peers. But the online retailer’s free cash flow multiple of 20 is still in line with, if not lower than, comparables.
3. Giant Tech Companies Can Get Even Bigger
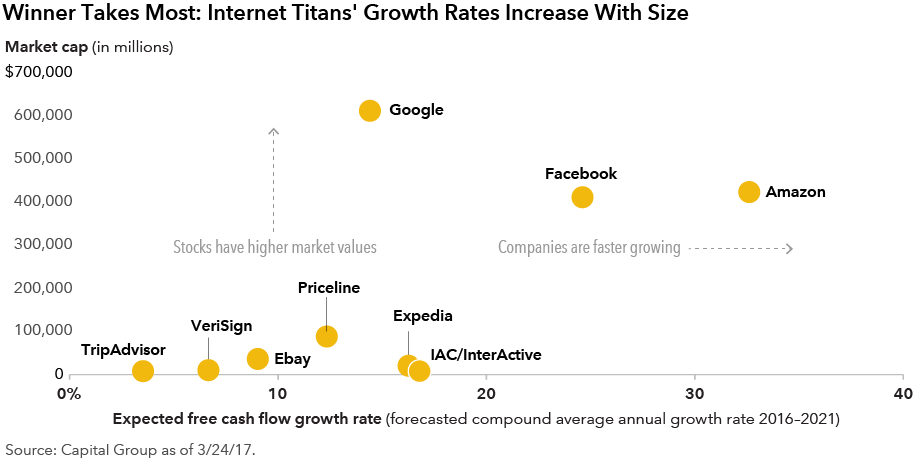
The “winner takes most” dynamic of the internet — where the largest companies capture a majority of incremental business — creates opportunities for investors. This is what I call the platform paradox: companies are growing faster as they’re getting bigger.
Despite being among the most valuable internet companies, both Amazon and Facebook are also the fastest growing based on expected free cash flow increases between 2016 and 2021. These massive companies are uniquely positioned to take advantage of the large amounts of advertising and e-commerce that will still move online.
Technology has only begun to change businesses ranging from advertising to retail and travel. In a decade or two, there will probably be three to five trillion-dollar, and potentially multi-trillion-dollar, technology companies powering the digital economy.
Given this favorable backdrop, when I hear that only 23% of the market’s value is from technology, I think that number should be far higher. I think that number will be far higher.
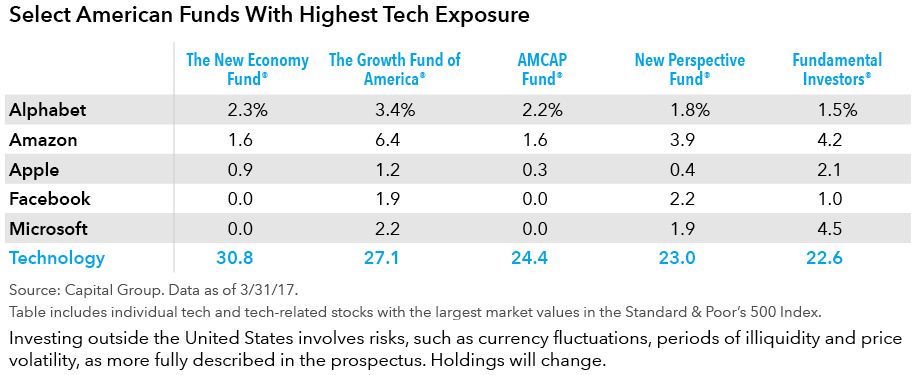
Investors looking to capitalize on what could be a coming era of mega-technology companies can look at five American Funds with significant investments in the technology sector and/or the large technology companies:
Past results are not predictive of results in future periods.
The S&P 500 Composite Index (“Index”) is a product of S&P Dow Jones Indices LLC and/or its affiliates and has been licensed for use by Capital Group. Copyright © 2018 S&P Dow Jones Indices LLC, a division of S&P Global, and/or its affiliates. All rights reserved. Redistribution or reproduction in whole or in part are prohibited without written permission of S&P Dow Jones Indices LLC.
Our latest insights
-
-
Economic Indicators
-
Demographics & Culture
-
Emerging Markets
-
Related Insights
Never miss an insight
The Capital Ideas newsletter delivers weekly insights straight to your inbox.
Statements attributed to an individual represent the opinions of that individual as of the date published and do not necessarily reflect the opinions of Capital Group or its affiliates. This information is intended to highlight issues and should not be considered advice, an endorsement or a recommendation.
 Will Craig