info
Some of our associates in Southern California are affected by the widespread wildfires. We are focused on ensuring that our associates who live in evacuation zones are safe and are saddened by the devastating impact to our Los Angeles communities. At this time, all of our offices are open and all investment operations are running normally. We will update this notice if needed, but we are confident that we will not experience any business impact from the wildfires.

Economic indicators

Why the next economic recovery may be stronger than expected

Three questions have weighed on investors’ minds for months: Will there be a recession? How bad will it be? And what comes next?


The U.S. Federal Reserve’s aggressive campaign of interest rate hikes to combat persistent inflation has amplified the risk of recession. Recent banking sector turmoil, which will likely result in tighter credit conditions, could further that risk.


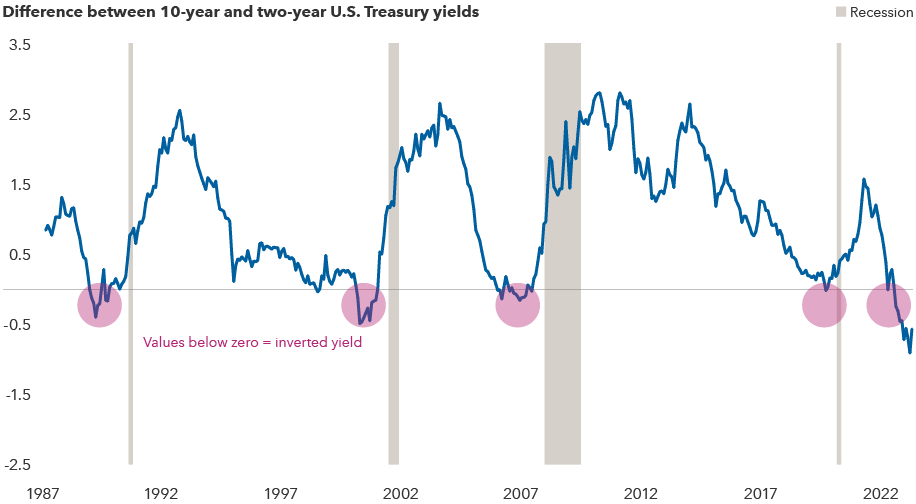
“One reliable indicator of a recession is an inverted yield curve, where the yield on short-term U.S. Treasury bonds is higher than the yield on longer dated bonds,“ says U.S. economist Jared Franz. “Recent activity in bond markets suggests a recession is widely expected. In fact, this may be the most widely anticipated recession in decades.”

The inverted yield curve warns of recession risk

The image presents the difference between 10-year and two-year U.S. Treasury yields from 1987 to 2023. When values, as represented by a fever line, fall below zero, it results in an inverted yield curve, which, historically speaking, has been a reliable predictor of impending recessions. Periods when the yield curve inverted include January 31, 1989, through September 29, 1989; February 29, 2000, through November 30, 2000; June 30, 2006, through May 31, 2007; and July 29, 2002, through March 31, 2003. Recessionary periods include September 30, 1990, through December 31, 1990; March 31, 2001, through September 30, 2001; December 31, 2007, through March 31, 2009; and March 31, 2020, through April 30, 2020.

Sources: Capital Group, Bloomberg Index Services Ltd., National Bureau of Economic Research, Refinitiv Datastream. As of March 31, 2023.

While many investors are focused on the timing and severity of the next recession, Franz has turned his focus to longer term questions: What could be the catalysts for a subsequent recovery? And what are some of the implications of that recovery for investor portfolios?


“When an insight is widely held, it can be challenging to benefit from that insight, as it may already be priced into the market,” Franz says. “Instead, investors may be better served by preparing for what I believe will be a stronger than usual recovery, fueled by a healthy consumer sector.”


Here, Franz shares his expectations for recession and his perspective on a potential subsequent recovery.

2025 Outlook webinar

CE credit available

Has the U.S. already entered a recession?


I believe we are on the edge of a recession. And with inflation still above the Fed’s 2% target and labor markets tight, the central bank still has work to do. Given the recent banking upheaval, I believe the Fed may temper its approach to rate increases, but I do believe it will be prepared to hike rates until inflation slows further.


I now expect a 1.0% decline in gross domestic product (GDP), or what would be considered a “mild” recession. That would be considerably milder than the 4.5% decline investors experienced during the global financial crisis (GFC) from 2007 to 2009, and closer to a more conventional recession. This is not to diminish the impact of recession on individuals. Recessions, no matter how mild, can be painful.


A weakening housing market is another risk factor. Sales fell in March, resulting in home price declines for a second straight month. But from here, I expect that prices may have a further 10% downside followed by a reacceleration. This will help limit any deterioration in household balance sheets, which may provide a boost to consumer confidence.

Will the next recovery be stronger or weaker than prior ones?


If there is one, I believe there are two reasons a recovery will be stronger than prior cycles. First, there may not be a need for large-scale deleveraging like there was during the GFC. Because so many companies have been expecting economic weakness, businesses have taken action, delaying orders to work excesses out of the economy. So, while a recession is likely this year, I expect it will be somewhat shallow.


Second, the U.S. consumer sector is strong relative to past cycles. Healthy job markets, wage growth and household wealth should be key catalysts for a more robust recovery.


Certainly, the U.S. labor market has been softening recently, and a recession of any magnitude will likely drive unemployment higher as companies announce layoffs. But the labor market has shown continued strength, with 236,000 jobs added in March. Why is that? Structural changes in labor markets have shifted labor supply and demand dynamics.


At the end of March, the unemployment rate stood at 3.5%, near multidecade lows. As the economy slows, unemployment will rise from here, but I believe it will peak around 5.0% and fall more quickly than we have seen in prior business cycles. And, since the start of the pandemic, work-from-home trends, along with the reshoring of supply chains back to the U.S. and the development of sustainable energy, have bolstered real wages, particularly for middle- and low-income workers.


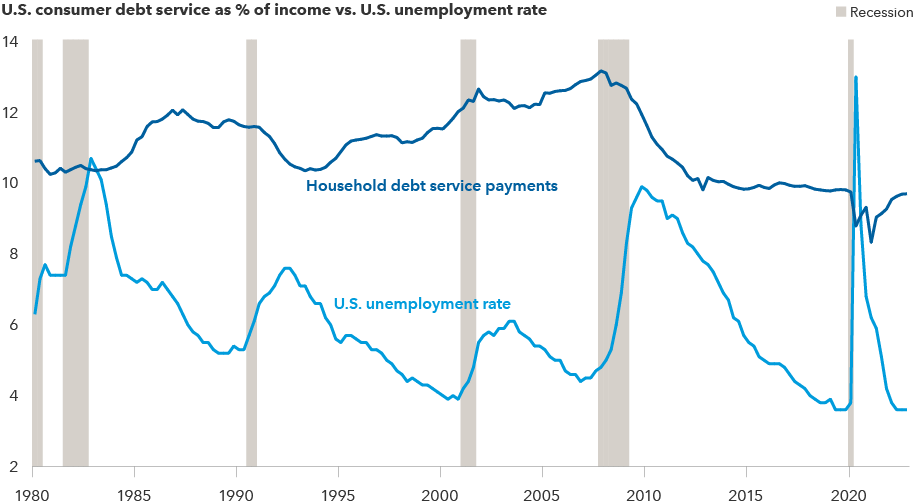
What’s more, at this point in the cycle, consumers have low debt relative to levels coming out of the GFC or even other more typical recessions. At the end of 2022, household debt service as a percentage of income stood at 9.7%.

Consumers are in better shape than they have been ahead of past recessions

The image shows a line graph reflecting U.S. consumer debt services as a percentage of total disposable income from March 31, 1980, through December 31, 2022. A second line tracks the U.S. unemployment rate over that same time. Household debt service payments as a percentage of disposable income ranged from a low of 8.33% on March 31, 2021, to a high of 13.17% on December 31, 2007. The chart also shows unemployment ranging from a low of 3.6% on December 31, 2022, to a high of 13% on June 30, 2020. Recessionary periods, represented by gray vertical lines, are as follows: March 31, 1980, through June 30, 1980; September 30, 1981, through September 30, 1982; September 30, 1990, through December 31, 1990; March 31, 2001, through September 30, 2001; December 31, 2007, through March 31, 2009; and March 31, 2023, through April 30, 2023.

Sources: Capital Group, Board of Governors of the U.S. Federal Reserve System, Bureau of Labor Statistics, National Bureau of Economic Research. Unemployment rate reflects the seasonally adjusted total unemployment rate. Household debt service payments as a percentage of total disposable income are seasonally adjusted, and the debt service component includes both mortgage payments and scheduled consumer debt payments. Data is quarterly, as of 12/31/2022.

What other factors could support a consumer-led recovery?


I expect moderating inflation to further support consumer strength. While it will take some time for the Fed to get inflation down to its 2.0% target, I believe it will be contained near 3.0%. Academic studies have shown that consumer spending has tended not to be significantly impacted by inflation around 3.0%. Contained inflation will likely boost consumer confidence. And, if wages hold up, it can feel like a real wage boost. I also expect inflation to edge toward 2.0% to 2.5% by 2025.


I believe we’ll also see productivity gains from automation and the increased adoption of artificial intelligence. This may provide an economic tailwind by helping to manage rising labor costs. That said, I do not expect such productivity gains to offset hiring needs in the near- to mid-term.


I also expect we will see stronger housing demand coming out of the recession. Changing demographics and rising household formation (a group of individuals who intend to live together), suggest a likely rebound in housing demand. I expect the popularity of working remotely to drive demand for housing development in suburbs, areas beyond the suburbs and second-tier cities, as well.

What does it mean for investors?


Solid labor market fundamentals, household balance sheets and moderating inflation could in my estimation lead to 3.0% growth in the U.S. consumer sector going forward. This is important because consumers account for about 67% of the U.S. economy. It is important to emphasize that a recession will cause some contraction in the labor market, but I expect the labor market to rebound.


Strong wages and consumer confidence could boost consumer spending, providing an uptick in a range of industries, including travel and leisure. What’s more, a housing market recovery could provide a tailwind not only to construction spending, but also spending for other durable goods, like household appliances.


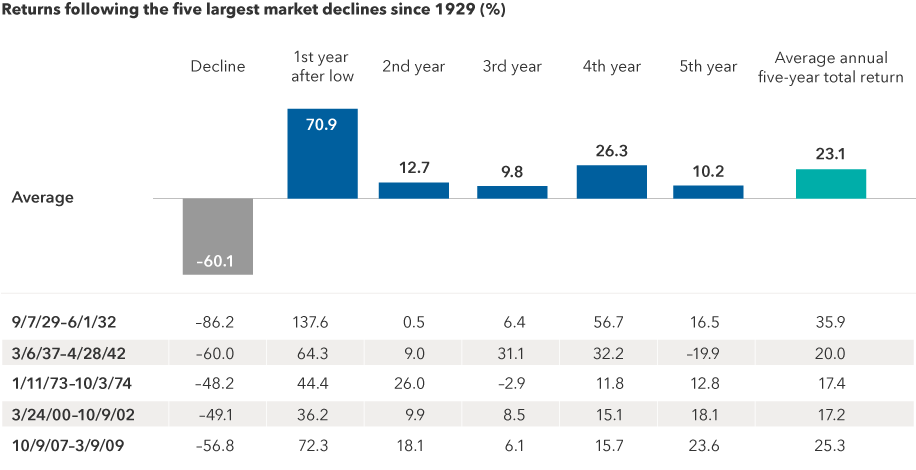
Historically, the stock market has tended to anticipate recoveries, rebounding ahead of any turn in the economy.

After large declines, markets have rebounded relatively quickly

The image shows the five largest market declines for the S&P 500 Index from 1929 to 2019, as well as returns for the subsequent five years. Of the 25 periods following the declines, there were 23 positive periods and two negative periods. The periods posting the five largest declines are as follows: September 7, 1929, through June 1, 1932, an 86.2% decline; March 6, 1937, through April 28, 1942, a 60.0% decline; January 11, 1973, through October 3, 1974, a 48.2% decline; March 24, 2000, through October 9, 2002, a 49.1% decline; and October 9, 2007, through March 9, 2009, a 56.8% decline. The average total return (combining all five periods) for the first year following the declines was 70.9%; for the second year, 12.7%; for the third year, 9.8%; for the fourth year, 26.3%; and for the fifth year, 10.2%. The average annual five-year total returns for all subsequent periods were 23.1%.

Sources: Capital Group, RIMES, Standard & Poor's. As of 12/31/2022. Market downturns are based on the five largest declines in the value of the S&P 500 Index (excluding dividends and/or distributions) with 100% recovery after each decline. The return of each of the five years after a low is a 12-month return based on the date of the low. The percentage decline is based on the index value of the unmanaged S&P 500, excluding dividends and/or distributions. The average annual total returns include reinvested dividends and/or distributions but do not reflect the effect of sales charges, commissions, account fees, expenses, or taxes. Past results are not predictive of results in future periods.

JASF

Jared Franz is an economist with 18 years of investment industry experience (as of 12/31/2023). He holds a PhD in economics from the University of Illinois at Chicago and a bachelor’s degree in mathematics from Northwestern University.

The S&P 500 Index is a market capitalization-weighted index based on the results of approximately 500 widely held common stocks. The index is unmanaged and, therefore, has no expenses. Investors cannot invest directly in an index.


The S&P 500 Index is a product of S&P Dow Jones Indices LLC and/or its affiliates and has been licensed for use by Capital Group. Copyright © 2023 S&P Dow Jones Indices LLC, a division of S&P Global, and/or its affiliates. All rights reserved. Redistribution or reproduction in whole or in part are prohibited without written permission of S&P Dow Jones Indices LLC.

Investments are not FDIC-insured, nor are they deposits of or guaranteed by a bank or any other entity, so they may lose value.
Investors should carefully consider investment objectives, risks, charges and expenses. This and other important information is contained in the fund prospectuses and summary prospectuses, which can be obtained from a financial professional and should be read carefully before investing.
Statements attributed to an individual represent the opinions of that individual as of the date published and do not necessarily reflect the opinions of Capital Group or its affiliates. This information is intended to highlight issues and should not be considered advice, an endorsement or a recommendation.
All Capital Group trademarks mentioned are owned by The Capital Group Companies, Inc., an affiliated company or fund. All other company and product names mentioned are the property of their respective companies.
Use of this website is intended for U.S. residents only. Use of this website and materials is also subject to approval by your home office.
Capital Client Group, Inc.
This content, developed by Capital Group, home of American Funds, should not be used as a primary basis for investment decisions and is not intended to serve as impartial investment or fiduciary advice.