Interest rates

Will economic uncertainty knock the Fed off course?

The U.S. Federal Reserve, once the primary driver of markets, has taken a back seat this year to government actions and politics. So far, it’s been a bumpy ride.


An avalanche of changes coming out of Washington, D.C., around tariffs, federal layoffs and immigration has raised questions about the trajectory of inflation and growth, sending the U.S. stock market into a correction and clouding the Fed’s outlook. Market discussions have shifted away from optimism about a soft landing to worries about declining growth and stagflation. Against this backdrop, the Fed kept its finger firmly on the pause button at Wednesday’s policy meeting as it adopted a wait-and-see approach. Investors are now left wondering about the Fed’s next move.


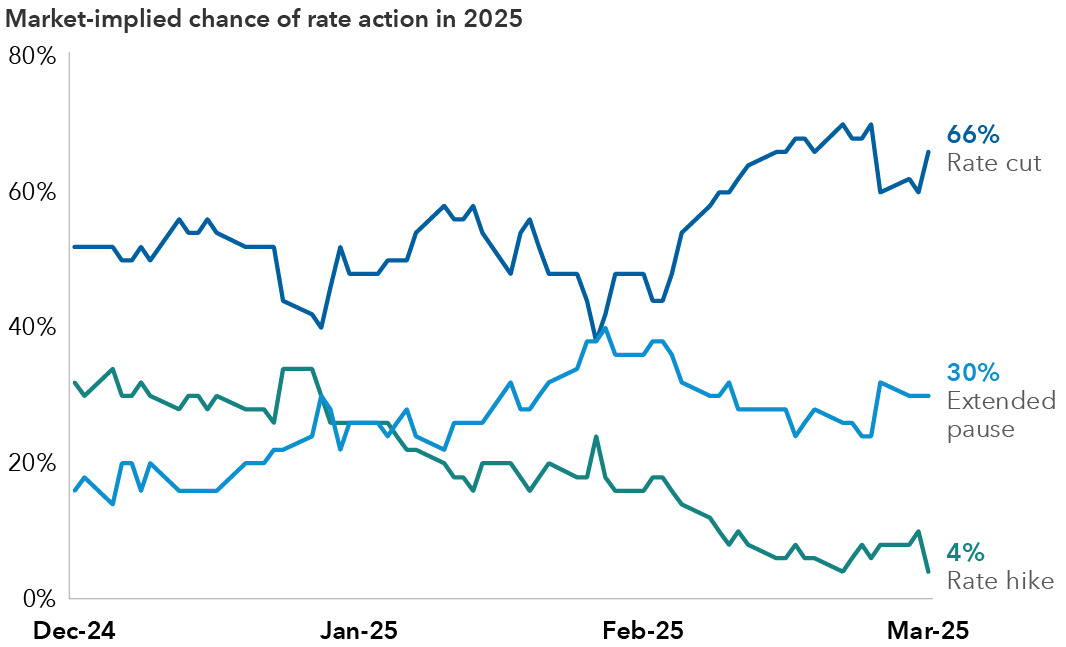
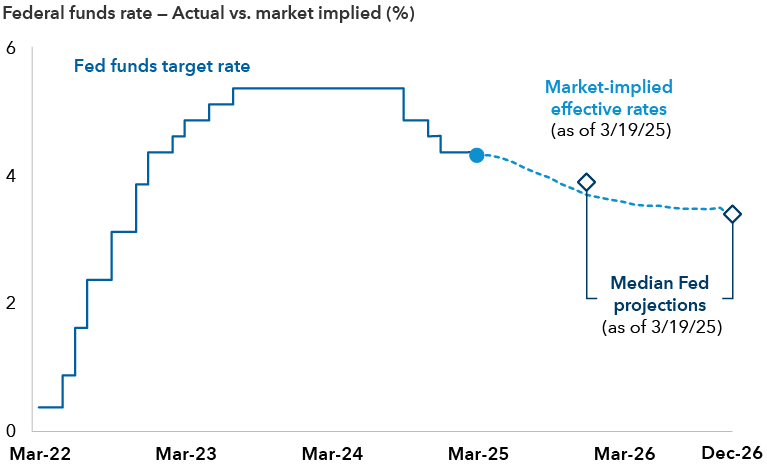
In my view, rate cuts remain the most likely outcome this year, though I see a patient Fed taking its time before pulling the trigger. Rate reductions are also on the market’s radar; futures markets indicate that the likelihood of a rate cut in 2025 reached about 66% after the March 19 meeting, compared with about 50% in mid-February. Meanwhile, the likelihood of a rate hike this year has fallen into single-digit territory. Separately, the market is pricing in between two to three 25 basis point cuts in 2025, compared with the two projected by the Fed.

Investors are increasingly looking for rate cuts this year

A fever-line chart depicts the market-implied probabilities of three actions. One line represents a rate cut, while two others represent a rate hike and a rate pause, respectively, between December 2024 and March 2025. The cutting line, which starts around 50%, fluctuates and ends at approximately 66%. The hiking line begins around 30%, decreasing steadily to about 4%. The line representing a pause starts around 20%, peaks near the end of January at about 40%, and then declines to approximately 30%.

Source: Bloomberg. SOFR options are financial derivatives that give the holder the right, but not the obligation, to buy or sell a three-month SOFR futures contract at a specified price before a certain date. Cut probabilities are calculated based on the pricing of December 2025 expiry call spreads using SOFR options. Hike probabilities are calculated based on the pricing of December 2025 expiry put spreads using SOFR options. Pause probabilities are the residual after accounting for cut and hike probabilities. As of March 19, 2025.

Despite the volatility, fixed income remains attractive given my views on the potential range of outcomes. While it may be tempting to limit duration given heightened uncertainty, investors should consider increasing duration due to the possibility of deeper Fed rate cuts than anticipated either due to inflation remaining contained or the economy faltering. Investors with low duration, credit-heavy portfolios may find themselves exposed during an equity market selloff.


In considering the wide range of potential outcomes and looking at market valuations across rates and credit, I am taking a balanced approach to portfolio construction. That includes yield curve positioning that may offer some protection to portfolios in multiple scenarios, including an equity market slump, alongside a diversified approach to credit sectors.


Here’s how I’m thinking about the probabilities behind the three scenarios and considerations for portfolio positioning:

Scenario 1: The Fed maintains its rate freeze


The Fed hit pause on rate cuts in January, holding the federal funds target rate in a range of 4.25% to 4.50%, and ending a streak of three meetings where rates fell by a full percentage point.

The Fed remains on hold after a series of rate reductions

A step line chart depicts the Fed funds target rate from March 2022 to March 2025, with an increase from near 0% in March 2022 to around 4.75% by February 2023, then remaining flat until September 2024. It then decreases to 4.40% in March 2025. From there, a dotted line indicates the market-implied effective rates as of March 19, 2025, showing a gradual decline to about 3.7% in December 2025 and about 3.3% in December 2026. Callout lines mark the median Fed projections as of March 19, 2025, reaching about 3.9% in December 2025, and about 3.4% in December 2026.

Sources: Capital Group, Bloomberg, U.S. Federal Reserve. The Fed funds target rate shown is the midpoint of the 50 basis point range that the Fed aims for in setting its policy interest rate. Market-implied effective rates are a measure of what the Fed funds rate could be in the future and are calculated using Fed funds rate futures market data. Median Fed projections are sourced from the Federal Open Market Committee’s Summary of Economic Projections. As of March 19, 2025.

In the short term, we on the U.S. rates team think the Fed will stay on hold. Following the 2024 cuts, we are now closer to the neutral rate (where the Fed is trying neither to stimulate or restrict the economy). We believe the Fed is in a relatively good spot in terms of its dual mandate, with inflation generally trending toward its 2% target and a slowing yet seemingly resilient labor market. Still, the Consumer Price Index (CPI), which stood at 2.8% in February, as well as the core Personal Consumption Expenditures (PCE) Index, which was 2.6% in January, remain elevated.


The Fed has indicated that it’s seeking clarity on the path of Trump administration policies before it moves. In particular, monetary policymakers will need to better understand the impacts on inflation and employment — the components of its dual mandate to promote maximum employment and price stability.


"Uncertainty around the changes and their effects on the economic outlook is high. As we parse the incoming information, we are focused on separating the signal from the noise as the outlook evolves,” said Fed Chair Jerome Powell in a March 19 press conference. “We do not need to be to be in a hurry to adjust our policy stance, and we are well positioned to wait for clarity.”


Details on tariffs, including the magnitude and duration as well as any retaliatory actions potentially leading to an all-out trade war, remain a major uncertainty. Impacts from changes to immigration policy, tax cuts and deregulation are also significant sources of unpredictability. Some of these individual changes can have diametric impacts on inflation and growth, making the overall impulse for interest rate policy unclear. Amid this uncertainty, we believe Fed officials may be less willing to make significant moves.


Should the Fed hold rates steady, we anticipate bonds will continue to provide attractive income opportunities given historically elevated starting yields. In this scenario, we expect U.S. Treasuries to remain range bound, with 10-year yields in the range of 4% to 5%. Investors who already boosted their fixed income allocations as cuts began may see opportunities to add more interest rate exposure if yields drift into the upper end of that range.

Scenario 2: The Fed resumes rate cuts


As the Fed parses data on inflation, I see encouraging signs that additional rate reductions may be on the table later this year.


Broad-based inflationary pressures, which defined price movements in 2021 and 2022 while spurring aggressive rate hikes, appear to have eased back to pre-pandemic levels. Looking at the distribution of inflationary trends within the CPI basket, about 50% of the basket is at or below the Fed’s 2% target in terms of its annualized rate of inflation. That includes a number of components where prices are outright falling. In addition, the downward price trend in shelter — the largest component of CPI — may continue to filter through and push the headline stat lower.

Inflationary pressures are returning to pre-pandemic levels

Two fever lines depict different economic indicators between February 2017 and February 2025. One line depicts the Consumer Price Index year-over-year (CPI YoY), which is on the left axis and ranges between 0% to 10%. The other line represents the share of the CPI basket with a 2% or lower annualized rate of inflation, which ranges from 0% to 80% on the right axis. Key points include a peak in CPI YoY around mid-2022 and a corresponding dip in the share of CPI basket with low inflation. By February 2025, CPI YoY was at approximately 2.8%, while the share of low-inflation items was around 50%.

Sources: Bloomberg, U.S. Bureau of Labor Statistics. As of March 12, 2025. Figures on CPI basket represent the share of 161 categories that are inflating at a 2% or lower rate, on a six month average annualized basis.

If economic conditions deteriorate to the point where they start threatening labor markets, we’d anticipate deeper rate cuts. While unemployment remained in its historically low range at 4.1% in February, there are potential risks to growth from tariffs and federal government layoffs. We’re also closely watching consumer sentiment for signs that the specter of reinflation and ongoing market volatility are having a negative impact.


I think the Fed could have enough clarity on economic data and fiscal policy to potentially lower rates in the second half of the year, assuming the economy doesn’t weaken and push the Fed to cut even sooner. Falling rates could lead to price appreciation for bonds, especially those with longer durations as they are more sensitive to changes in interest rates. Bonds may also be expected to help diversify portfolios as stock-bond correlations have begun to normalize.

Get insights and services tailored to you

Scenario 3: The Fed makes a U-turn and hikes rates


A return to rate hikes, while not an outcome I anticipate, cannot be dismissed. Under certain economic conditions, the Fed may be inclined to tighten monetary policy.


In one possible outcome, the Trump administration could implement deep and sustained tariffs, leading to a broadening of inflationary pressures. However, the stagflation and lower growth environment that typically accompanies tariffs could complicate the Fed’s response.


On the other hand, an overheated economy, potentially fueled by capital expenditures, tax cuts and deregulation, could prompt the Fed to curb growth if consumer prices move meaningfully higher. That said, I believe the threshold of clear indicators needed for the Fed to hike rates is much higher than the threshold to lower rates.


In a rate hiking environment, I anticipate that yields would rise, particularly on the short end of the curve.

Amid uncertainty, balance may be best


When viewing the mosaic of rate path probabilities and the magnitude of rate moves, I land in a spot where I see value in relatively high starting yields and moderate duration exposure — with tactical opportunities to increase duration further. Bonds appear well-positioned to provide potentially attractive income and ballast in investor portfolios as markets could remain volatile in the weeks and months ahead.

headshot-Timothy-Ng-TMTN-600x600

Timothy Ng is a fixed income portfolio manager with 18 years of investment industry experience (as of 12/31/2024). He holds a bachelor's degree in computer science from the University of Waterloo, Ontario.

Consumer Price Index (CPI) is a measure of the average change over time in the prices paid by urban consumers for a market basket of consumer goods and services.


Personal Consumption Expenditures (PCE) Index is a measure of consumer spending on goods and services among households in the U.S. The PCE is used as a mechanism to gauge how much earned income of households is being spent on current consumption for various goods and services.


Duration measures a bond’s sensitivity to changes in interest rates. Generally speaking, a bond's price will go up 1% for every year of duration if interest rates fall by 1% or down 1% for every year of duration if interest rates rise by 1%.


Stagflation is the combination of high inflation, stagnant economic growth and elevated unemployment.


A yield curve illustrates the yields on similar bonds across various maturities. Yield curve steepening occurs when long-term rates rise more than short-term rates, or short-term rates fall more than long-term rates.


BLOOMBERG® is a trademark and service mark of Bloomberg Finance L.P. and its affiliates (collectively “Bloomberg”). Bloomberg or Bloomberg’s licensors own all proprietary rights in the Bloomberg Indices. Neither Bloomberg nor Bloomberg’s licensors approves or endorses this material, or guarantees the accuracy or completeness of any information herein, or makes any warranty, express or implied, as to the results to be obtained therefrom and, to the maximum extent allowed by law, neither shall have any liability or responsibility for injury or damages arising in connection therewith.

Investments are not FDIC-insured, nor are they deposits of or guaranteed by a bank or any other entity, so they may lose value.
Investors should carefully consider investment objectives, risks, charges and expenses. This and other important information is contained in the fund prospectuses and summary prospectuses, which can be obtained from a financial professional and should be read carefully before investing.
Statements attributed to an individual represent the opinions of that individual as of the date published and do not necessarily reflect the opinions of Capital Group or its affiliates. This information is intended to highlight issues and should not be considered advice, an endorsement or a recommendation.
All Capital Group trademarks mentioned are owned by The Capital Group Companies, Inc., an affiliated company or fund. All other company and product names mentioned are the property of their respective companies.
Use of this website is intended for U.S. residents only. Use of this website and materials is also subject to approval by your home office.
Capital Client Group, Inc.
This content, developed by Capital Group, home of American Funds, should not be used as a primary basis for investment decisions and is not intended to serve as impartial investment or fiduciary advice.