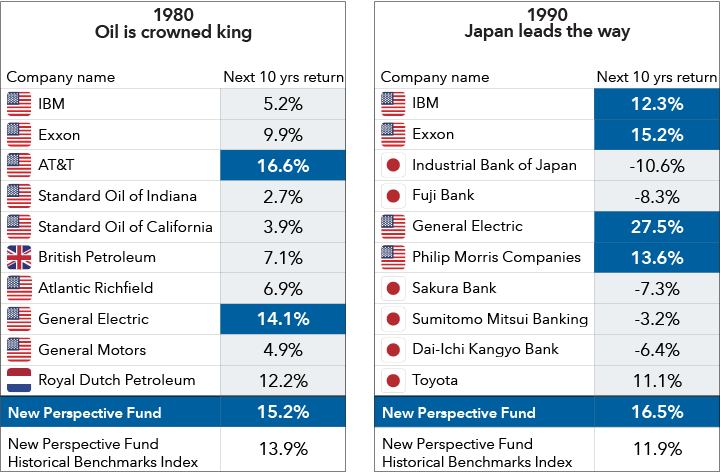
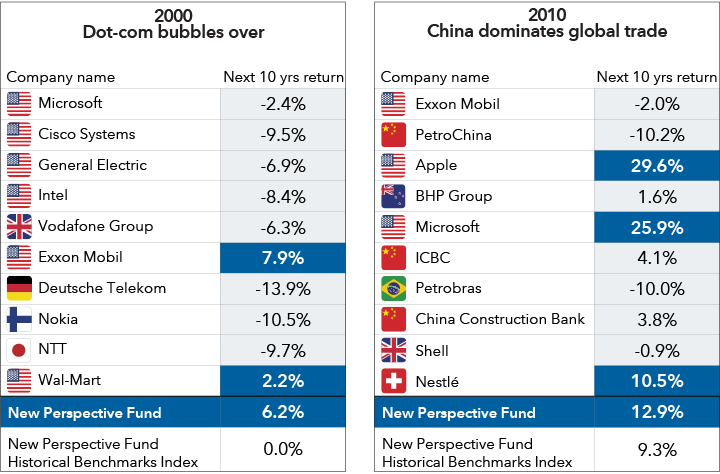
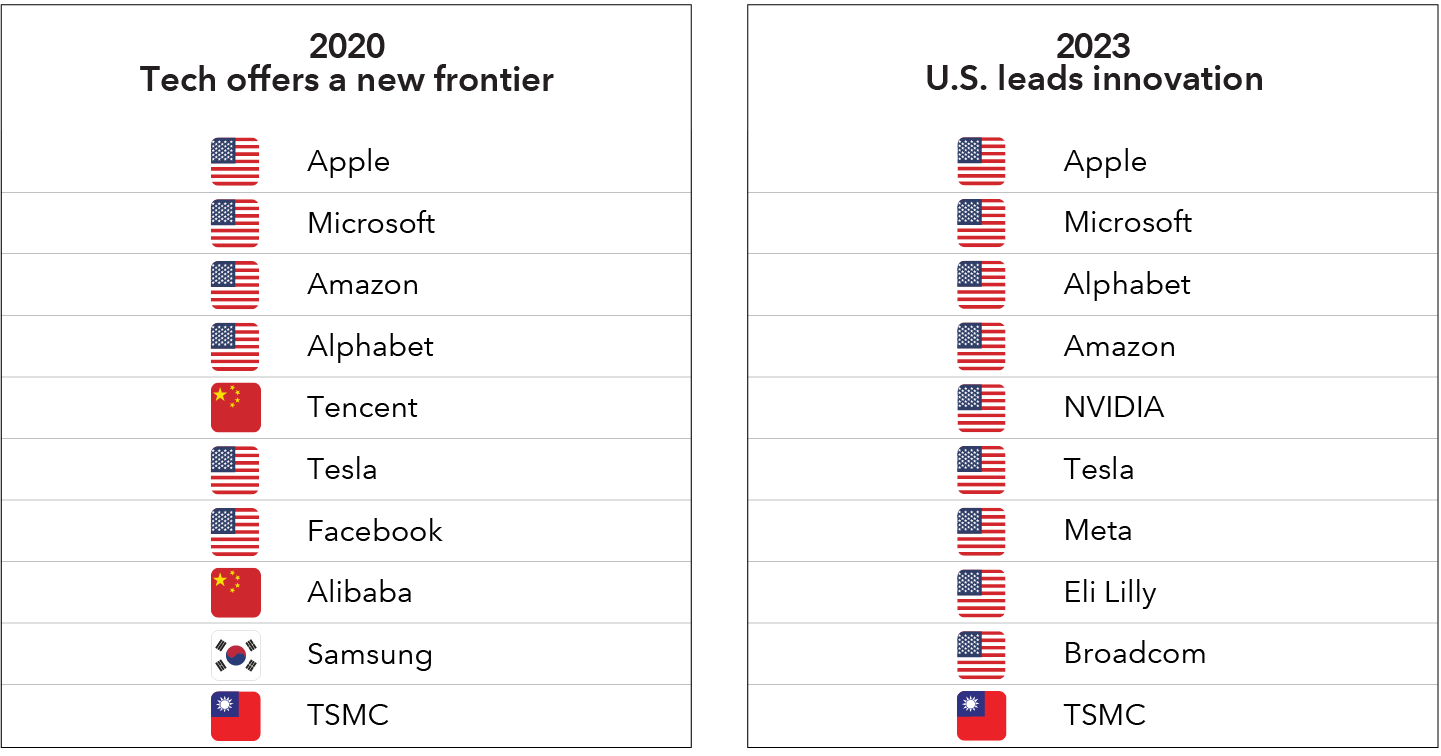
- Every decade has presented a largely new set of global leaders
- New Perspective Fund Historical Benchmarks Index, comprised of the MSCI World Index and MSCI All Country World Index, led most of the leaders in every time period
- New Perspective Fund (at F-2 shares) beat its benchmark index in all of these time periods
Read important investment disclosures
There’s no doubt that the Magnificent 7* (Alphabet, Amazon, Apple, Meta Platforms, Microsoft, NVIDIA and Tesla) have been dominant in recent years, but history has taught us that over time, market leadership has had a tendency to change, as has regional leadership.
For example, between the 1980s and the 1990s, 6 of the top 10 leaders by market cap changed from those domiciled in the United States and Europe over to those domiciled in Japan. And 10 years after that, there was only one Japanese company still in the top 10.

These tables show the 10 most valuable public companies by market capitalization in the world at the start of each decade along with their next 10 years return.
Source: Capital Group. As of December 31, 2023. “Next 10 yrs return” refers to the average annual total return of the stock or index from the current decade's beginning observation date to the beginning of the next decade. Observation date for each set of holdings is December 31 of the year. For example, for 1980, the observation date for the largest companies is 12/31/1980. The exception is for 2000, which uses the observation date of 2/28/2000, as it reflects the closest month-end peak of the tech bubble.
In the late 1990s, many companies’ stock valuations lifted during the dot-com boom, but the growth was stunted after the bubble burst. Then in the 2010s, several Chinese companies cracked the top 10, but only 3 of the 10 were able to outpace the index.

These tables show the 10 most valuable public companies by market capitalization in the world at the start of each decade along with their next 10 years return.
Source: Capital Group. As of December 31, 2023. “Next 10 yrs return” refers to the average annual total return of the stock or index from the current decade's beginning observation date to the beginning of the next decade. Observation date for each set of holdings is December 31 of the year. For example, for 1980, the observation date for the largest companies is 12/31/1980. The exception is for 2000, which uses the observation date of 2/28/2000, as it reflects the closest month-end peak of the tech bubble.
This underlines the importance of deep research and thoughtful stock selection to find consistent value, even when economic environments shift and the top companies lose favor. Time will tell if this remains true for the current decade, but it’s already clear that the leaders are following the trend of trading top positions.

These tables show the 10 most valuable public companies by market capitalization in the world at the start of each respective decade.
Source: Capital Group. As of December 31, 2023. Observation date for each set of holdings is December 31 of the year. For example, for 1980, the observation date for the largest companies is 12/31/1980. The exception is for 2000, which uses the observation date of 2/28/2000, as it reflects the closest month-end peak of the tech bubble.
For a flexible global approach to broader market exposure and diversification, investors may consider New Perspective Fund and CGGO Capital Group Global Growth Equity ETF as potential investment options.
* The "Magnificent 7" refers to a group of seven major technology stocks that had a significant impact on the market in 2023. These stocks are Apple, Microsoft, Alphabet, Amazon, NVIDIA, Meta Platforms and Tesla.