Important information

THIS CONTENT IS INTENDED FOR REGISTERED INVESTMENT ADVISERS AND FOR THEIR USE WITH THEIR CLIENTS ONLY.


In order to access content on the Capital Group Financial Professionals website (the “Site”) regarding Capital Group’s (“CG’s”) Separately Managed Accounts, Model Portfolios and investment advisory services (“CG RIA content”), please read the following information and affirm by clicking the accept button that you have read and understand the information provided.


To access CG RIA content on the Site, you must attest that you are an investment adviser registered with the U.S. Securities and Exchange Commission or under applicable state law and accept these Terms and Conditions. Some content on the Site may require additional registration for access.


CG RIA content is solely intended for registered investment advisers who have agreed to these Terms and Conditions and for their use with their clients. By agreeing to these Terms and Conditions you are affirming that you are an investment adviser registered with the U.S Securities and Exchange Commission or under applicable state law and possess the financial sophistication and resources to understand and analyze the content presented herein. Further, by agreeing to these Terms and Conditions you are affirming your understanding that your use of this content with your clients is at your discretion, and it is your responsibility to ensure they understand the material and it is appropriate for their financial situation. 


You understand that the CG RIA content does not constitute advice of any nature, including fiduciary investment advice by Capital Group or its associates.


Reference to “Capital Group” used herein includes The Capital Group Companies, Inc., and its affiliates.

Amid interest rate volatility, muni SMAs may outshine ladders

KEY TAKEAWAYS

  • After years of rate hikes, investors are now likely facing an era of meandering rate cuts. 
  • Muni bond ladders, while popular, may not be as effective of a strategy amid yield curve volatility.
  • A separately managed account (SMA) could be a better option for many investors, due to tactically implemented actively managed duration, curve and security selection.

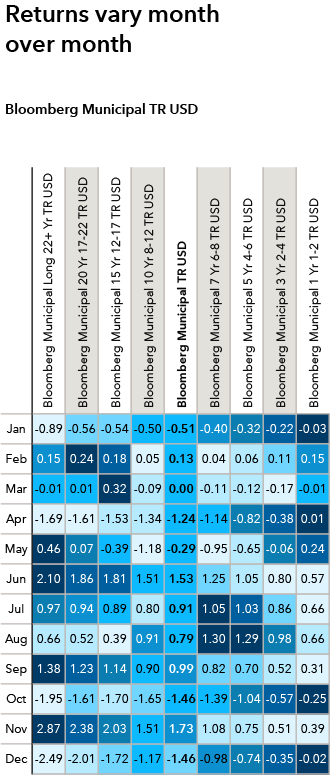
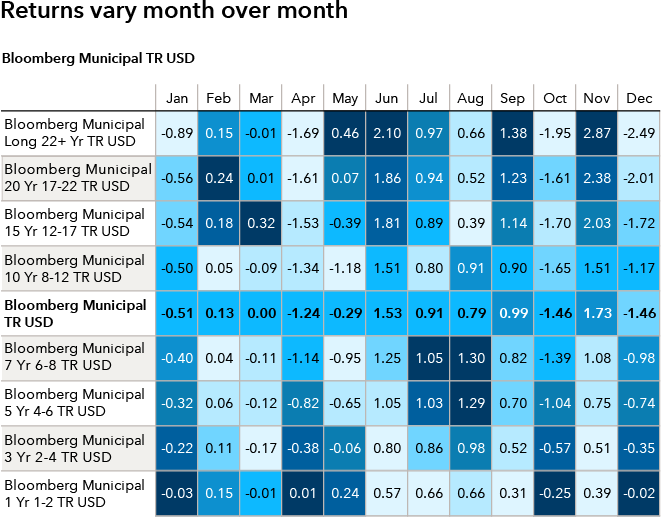
After years of giving investors heartburn, interest rate volatility has some lingering impacts. While the U.S. Federal Reserve cut rates three times in late 2024, it paused cuts in its January meeting and now anticipates only two cuts for 2025. With remaining cuts more meandering, likely to be deliberate and data-dependent, interest rates may remain elevated for a longer period. This would create an excellent opportunity for investors looking for income.
 

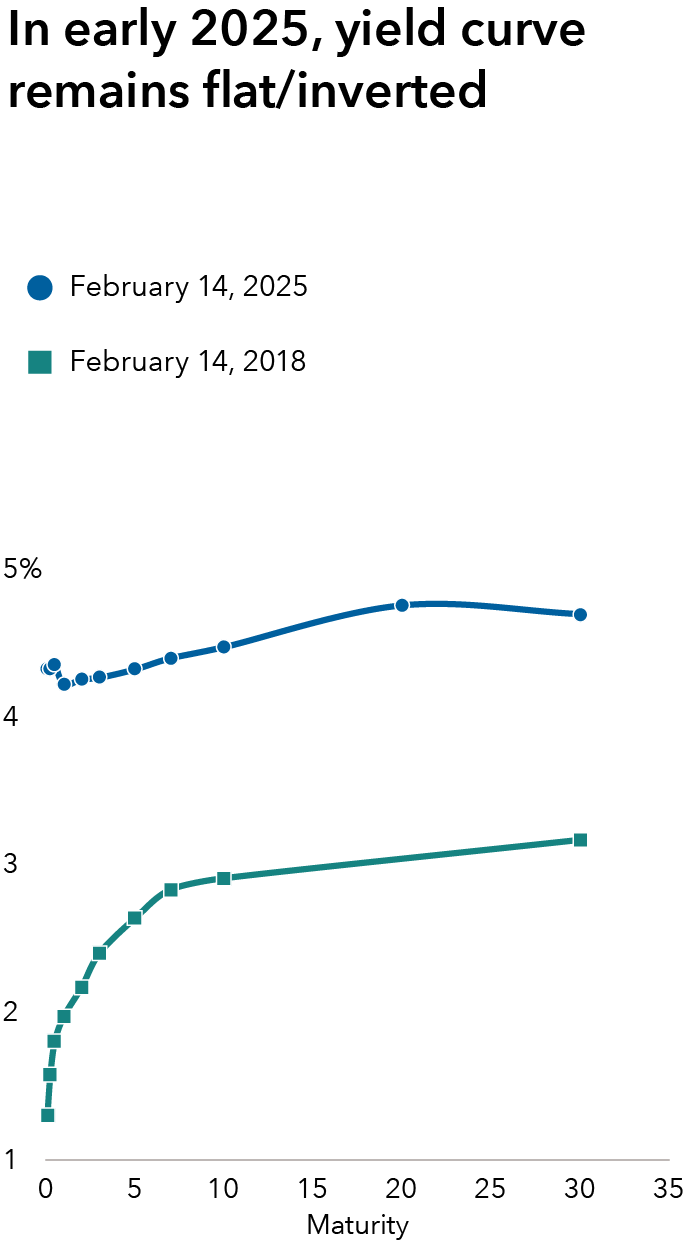
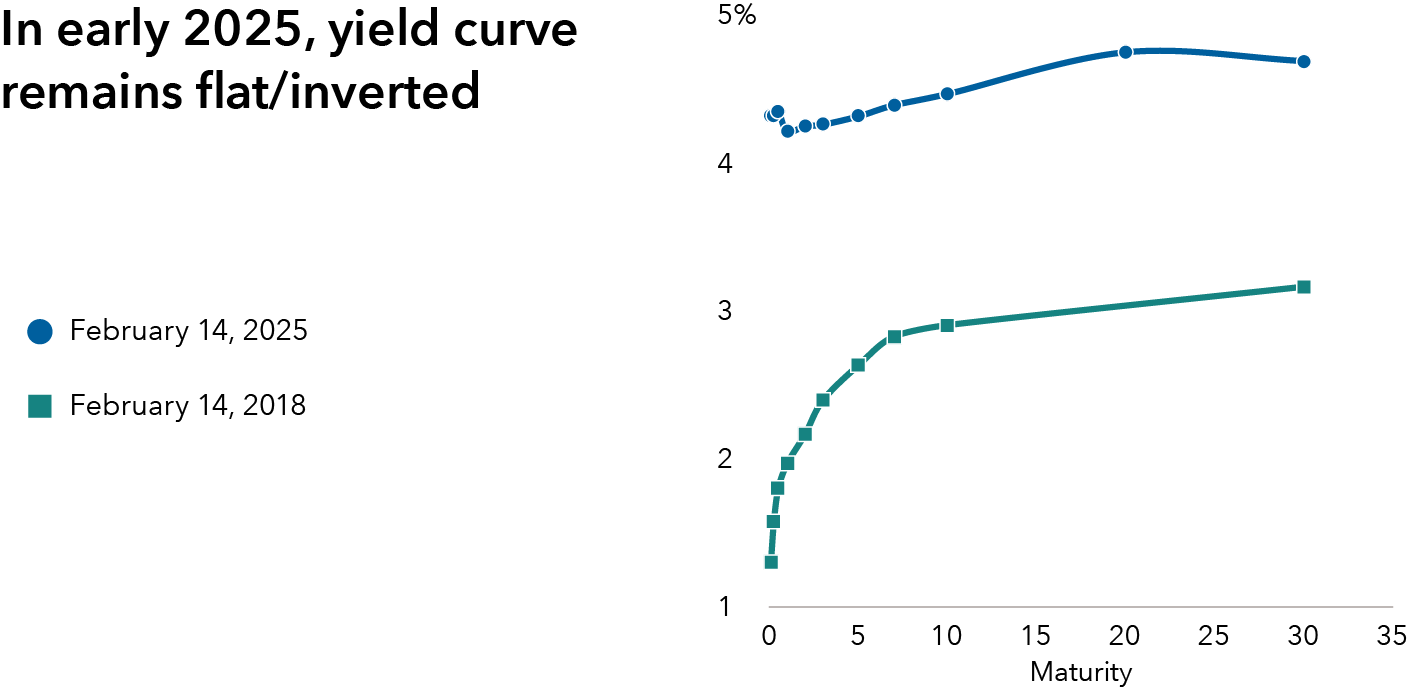
One group of income-seekers – municipal bond investors – has another consideration: The shape of the yield curve poses a problem for those who have relied on laddered strategies. A prolonged period of yield curve inversion – meaning shorter term interest rates were higher than longer term rates – turns the strategy of building a portfolio of bonds with increasing maturities and yields on its head. Even as the curve now just begins to normalize, it could be years before ladders’ value proposition makes sense again. Instead, an active approach to interest rate positioning that seeks to seize opportunities as the rates landscape evolves could benefit municipal bond investors.
 

Muni bond ladders: Popular, but potentially problematic
 

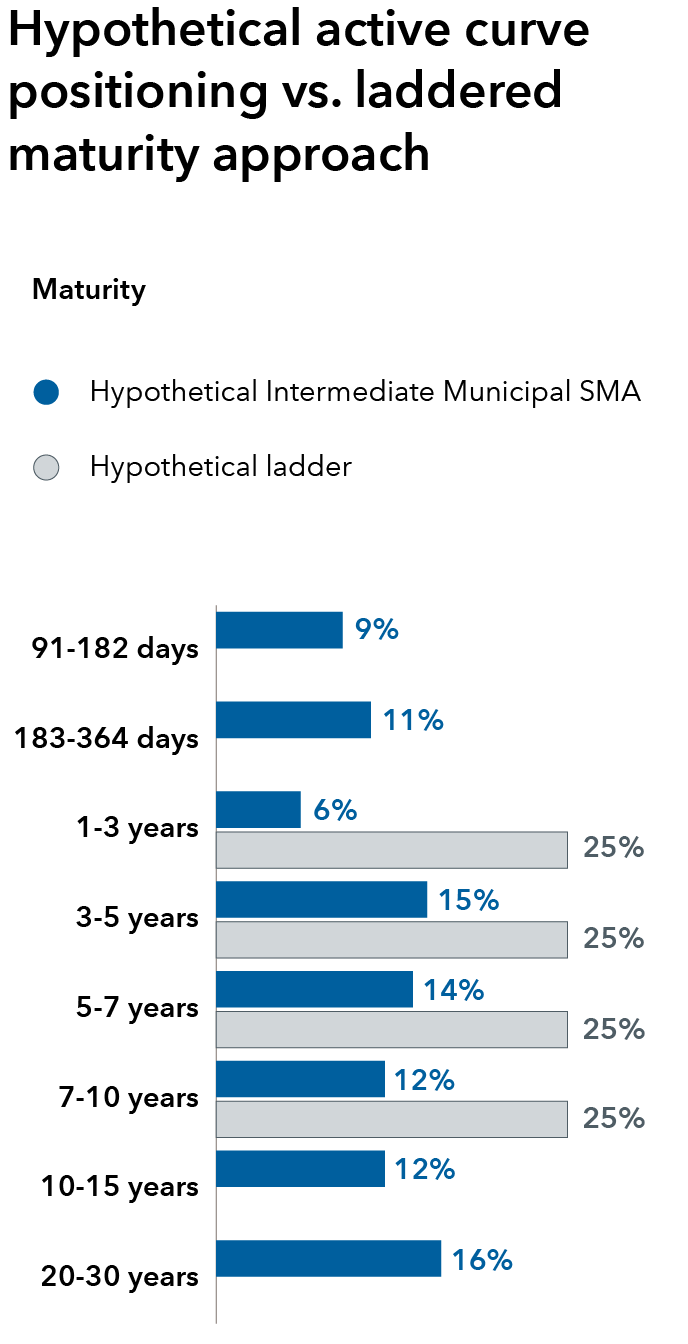
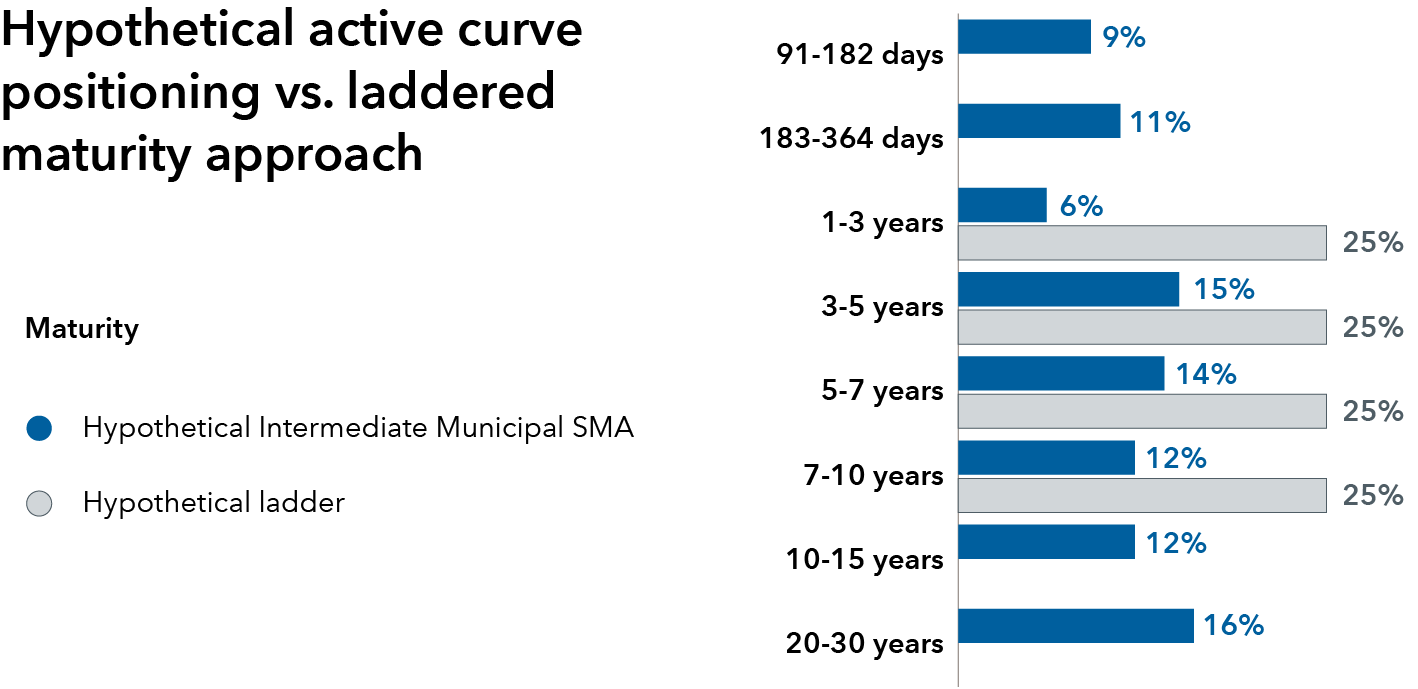
A muni bond ladder constitutes a portfolio of muni bonds of differing maturities, from shorter to longer. Upon maturity of the bond with the shortest life, the proceeds are typically reinvested in a new bond. That new bond becomes the longest maturity bond in the portfolio. This extends the ladder. The interest received from bond ladders is designed to be regular and predictable, and a ladder approach is easy to understand.
 

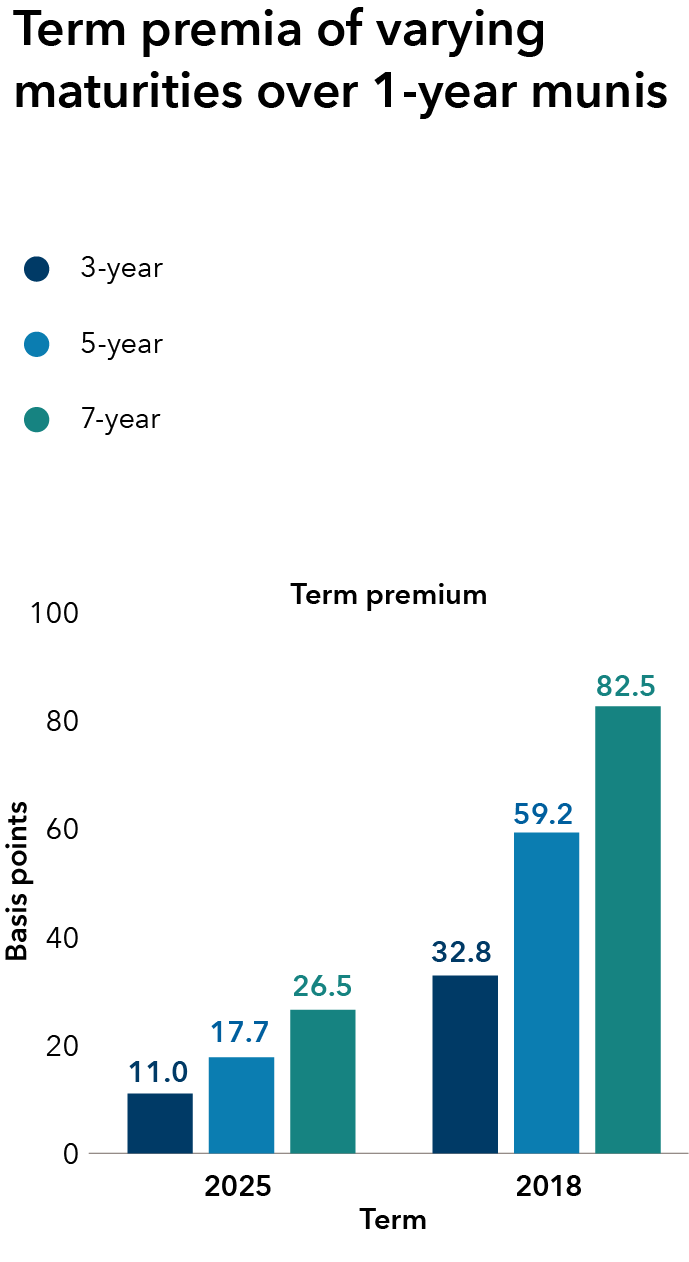
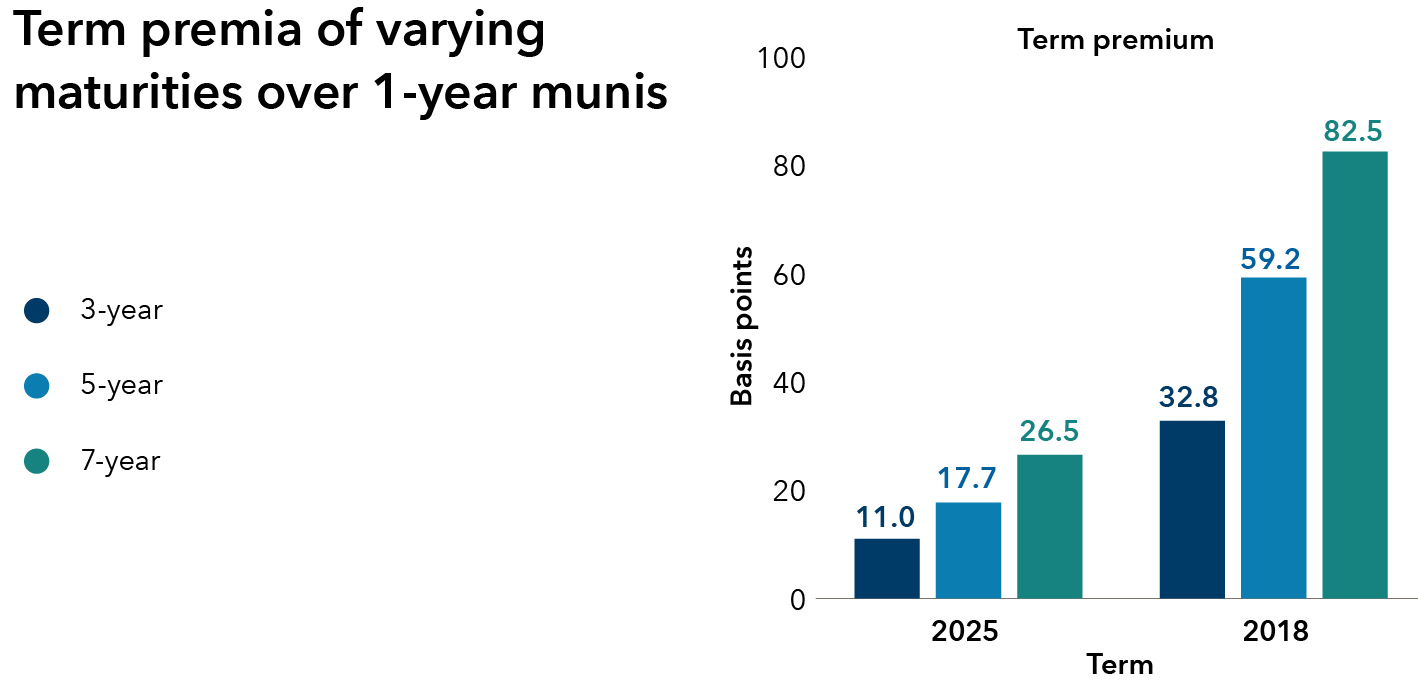
In a “normal” yield curve environment – when longer term bonds provide a term premium consisting of more yield than shorter term bonds – investors can benefit from the higher yields offered by the longer maturities. But we haven’t had a truly normal yield curve for some time. That means investors building ladders could be missing out on higher income potential.

The chart is titled, “In early 2025, yield curve remains flat/inverted.” The Y axis represents yield (%), starting at 1 with intervals of 1 until 5. The X axis represents maturities, starting at 0 with intervals of 5 until 35. For 2/14/2018, the curve starts at approximately 1.3 and slopes upward until ending at 30 at approximately 3.1. For 2/14/25, the curve starts at approximately 4.3 and curves downward, then extends with very little rise, until ending at 30 at approximately 4.6. The 2/14/2018 is a more normal by historical standards curve, the 2/14/2025 is a flat/inverted curve.

Source: Bloomberg. Treasury yields at different maturities are shown on a day in early 2025 compared to 7 years earlier when the curve's shape was more normal by historical standards. As of 2/14/25.

In today’s environment, ladders may not climb as high
 

As 2025 begins to get underway, the muni yield curve has started to normalize but isn’t there yet: It remains largely inverted or flat. In this environment, ladders may not be ideal because long-term rates are not as attractive to investors, as they are not compensated for extension risk (e.g., extending the ladder with longer term investments). In fact, term premiums (the expected additional compensation for taking longer term risk) are very low versus a one-year muni investment. The term premiums are low compared to just a few years ago. Ladders anticipate that term premiums will increase as longer term bonds are purchased; however, adding that extension risk is not paying off today, as illustrated below.

The chart is titled, “Term premia of varying maturities over 1-year munis.” The y axis is labeled “Basis points” and the x axis is labeled “Term.” The y axis is 0 through 100 in increments of 20. For 2025, the data on the x axis is 3 year 11.0, 5 year 17.7 and 7 year 26.5. For 2018, the data on the x axis is 3 year 32.8, 5 year 59.2 and 7 year 82.5.

Source: Bloomberg. Data as of February 14 for each year shown. This illustrates BVAL Muni Benchmark 1-year, 3-year, 5-year and 7-year. The BVAL Muni Benchmark indices are populated by high-quality U.S. municipal bonds with an average rating of AAA from Moody’s and S&P.

While it’s anticipated the curve will eventually fully normalize, with long-term rates higher than short-term rates, no one can predict exactly when this will occur. Ladders are built with the assumption the curve is “upward-sloping” – in other words, the curve rises. Then, extending the ladder with fresh bonds purchased using proceeds from maturing bonds should deliver higher yields relative to simply buying short-term bonds. But in a downward-sloping or flat curve, that’s not always the case. This is referred to as “reinvestment risk.”
 

We believe there are three important considerations for investors in this environment: Duration, curve and diversification.
 

Duration management can provide an edge in a shifting interest rate environment
 

Duration represents interest rate risk; it’s the sensitivity of a bond to changes in interest rates. Bonds with longer durations are typically more sensitive to interest rate risk than shorter duration bonds. As noted, when the curve is normal (upward-sloping), investors are compensated for interest rate risk with higher yields. In a downward-sloping or flat yield curve, investors are not compensated for that risk. Bond ladders are “one and done” purchases, with no flexibility to address duration risk.
 

In contrast, active managers can help control, monitor and adjust duration depending on the investment opportunities and market environment in the portfolios they manage. They can also actively consider reinvestment risk timing. An actively managed portfolio may be modified to have more or less duration exposure. In a volatile interest rate environment like today’s, active managers may have opportunities to seek value in shifting interest rate expectations, unlike static ladder portfolios.
 

Rate volatility’s other opportunity: Active curve positioning
 

Curve positioning represents the opportunity to express conviction on how bonds with different maturity profiles might be impacted by rate volatility. Active management allows managers to pick and choose different maturities, unlike ladders, which do not have flexibility to pivot on curve exposure beyond the initial purchase.
 

Using 2024 as an example of a period with elevated interest rate volatility, the strongest returns across the muni curve often differed from month to month. This provided opportunities for managers whose research can help determine which parts of the curve look most promising at a given time. The table below shows indexes with different maturities reflecting different parts of the yield curve. Notice how the returns are continually shifting throughout the year: There’s no single maturity profile that consistently outpaced the others. 

The chart is titled, “Returns vary month over month.” A callout states “Bloomberg Municipal TR USD.” The chart illustrates how returns vary month over month and no single index consistently outperforms. The y axis is labeled with Bloomberg Municipal with different maturities, and has 9 lines. The x axis is labeled Jan, Feb, Mar, Apr, May, Jun, Jul, Aug, Sep, Oct, Nov and Dec. Bloomberg Municipal Long 22+ Yr TR USD is -0.89, 0.15, -0.01, -1.69, 0.46, 2.10, 0.97, 0.66, 1.38, -1.95, 2.87, -2.49. Bloomberg Municipal 20 Yr 17-22 TR USD is -0.56, 0.24, 0.01, -1.61, 0.07, 1.86, 0.94, 0.52, 1.23, -1.61, 2.38, -2.01. Bloomberg Municipal 15 Yr 12-17 TR USD is -0.54, 0.18, 0.32, -1.53, -0.39, 1.81, 0.89, 0.39, 1.14, -1.70, 2.03, -1.72. Bloomberg Municipal 10 Yr 8-12 TR USD is -0.50, 0.05, -0.09, -1.34, -1.18, 1.51, 0.80, 0.91, 0.90, -1.65, 1.51, -1.17. Bloomberg Municipal TR USD is -0.51, 0.13, 0.00, -1.24, -0.29, 1.53, 0.91, 0.79, 0.99, -1.46, 1.73, -1.46. Bloomberg Municipal 7 Yr 6-8 TR USD is -0.40, 0.04, -0.11, -1.14, -0.95, 1.25, 1.05, 1.30, 0.82, -1.39, 1.08, -0.98. Bloomberg Municipal 5 Yr 4-6 TR USD is -0.32, 0.06, -0.12, -0.82, -0.65, 1.05, 1.03, 1.29, 0.70, -1.04, 0.75, -0.74. Bloomberg Municipal 3 Yr 2-4 TR USD is -0.22, 0.11, -0.17, -0.38, -0.06, 0.80, 0.86, 0.98, 0.52, -0.57, 0.51, -0.35. Bloomberg Municipal 1 Yr 1-2 TR USD is -0.03, 0.15, -0.01, 0.01, 0.24, 0.57, 0.66, 0.66, 0.31, -0.25, 0.39, -0.02.

Source: Morningstar. Data as of 12/31/24. The indexes are unmanaged and, therefore, have no expenses. Investors cannot invest directly in an index. Past results are not predictive of results in future periods.

Diversification: The third leg of the stool


Diversification among security selection serves an important purpose for a portfolio. With active management, a team of investment analysts, traders and portfolio managers can be incredibly beneficial. Teams can analyze bonds not only for information about the issues, but for valuation and the relative value between different bonds. Analysts can collaborate for a more holistic view of the market. Traders can offer insight on new issues pricing, secondary market activity, sector-specific developments and execution choices. Portfolio managers, along with the rest of the team, can study bond issues, talk to managers and perform onsite visits.
 

A final consideration: Cost
 

Cost is another factor. According to the Municipal Securities Rulemaking Board paper, Analysis of Primary vs. Recently Issued and Competitive vs. Negotiated Municipal Securities Markets, “individual investors often obtain a large portion of their bonds in the recently issued market and at higher prices than institutional investors.” Individual investors also paid higher spreads, as “smaller trade sizes had an average spread of just over $10.00 compared to less than $5.00 for larger-size trades.”
 

SMAs might be a solution for savvy investors
 

While active mutual funds and exchange-traded funds (ETFs) can provide these potential advantages, muni separately managed accounts (SMAs) could benefit investors looking for some customization. Muni SMAs are built with individual bonds that provide the same tax-sensitive treatment as muni bond ladders. They aim to provide current income exempt from federal tax. Investors own the individual bonds in their SMA – a notable distinction from a mutual fund or ETF. The active management in SMAs may reduce reinvestment risk relative to a laddered portfolio.
 

For example, as interest rate markets move amid policy uncertainty, active SMA managers can vary exposures across the entire yield curve, emphasizing or deemphasizing attractive/unattractive maturity profiles. This is differentiated from a ladder, which has a “locked in” position once purchased. Here’s a sample of a hypothetical ladder with four equal allocations to maturities ranging from 1–3 years to 7–10 years and actively managed SMA. Notice the flexibility of the SMA can take positions all across the yield curve.

The chart is titled, “Hypothetical active curve positioning vs. laddered maturity approach.” The legend is labeled “maturity” and lists hypothetical intermediate municipal SMA and hypothetical ladder. For the hypothetical intermediate municipal SMA, the data is 91-182 days 9%, 183-364 days 11%, 1-3 years 6%, 3-5 years 15%, 5-7 years 14%, 7-10 years 12%, 10-15 years 12% and 20-30 years 16%. For the hypothetical ladder, the data is 25% for 1-3 years, 3-5 years, 5-7 years and 7-10 years.

Source: Capital Group.

Muni SMAs may also allow investors to select state specific, state preference or state best efforts, for income potentially exempt from state taxes. These investment vehicles may also offer a custom transition analysis/in-kind transitions and potential tax loss harvesting.
 

To learn more about the potential advantages of SMAs, visit here. For more detailed information about muni SMAs, visit Capital Group Short Municipal, Capital Group Intermediate Municipal or Capital Group Long Municipal


Investors should be aware of all their options in determining how to best achieve their goals. While muni bond ladders are available, there may be opportunity for investors to gain more yield, and thus more income, with other investment vehicles. Unlike bond ladders, muni SMAs may consider not only security selection, but duration and curve positioning to build portfolios, all with a team of highly trained analysts, traders and managers seeking opportunities in this tax-sensitive market. Investors may want to consider muni SMAs in the current environment of interest rate volatility.

gregory-ortman-color-600x600

Gregory Ortman is a fixed income investment director with 30 years of experience (as of 12/31/2024). He holds a master’s degree in economics from Claremont Graduate University and a bachelor’s degree in economics from St. Edwards University in Austin, Texas.

IGSP

Ingrid Parl is an investment specialist with 14 years of industry experience (as of 12/31/2024). She holds a bachelor's degree in political science and psychology from Wesleyan University.

Read all perspectives on bond markets

Investments are not FDIC-insured, nor are they deposits of or guaranteed by a bank or any other entity, so they may lose value.
Bond ratings, which typically range from AAA/Aaa (highest) to D (lowest), are assigned by credit rating agencies such as Standard & Poor's, Moody's and/or Fitch, as an indication of an issuer's creditworthiness.
The indexes are unmanaged and, therefore, have no expenses. Investors cannot invest directly in an index.
Source: Bloomberg Index Services Limited. BLOOMBERG® is a trademark and service mark of Bloomberg Finance L.P. and its affiliates (collectively "Bloomberg"). Bloomberg or Bloomberg's licensors own all proprietary rights in the Bloomberg Indices. Neither Bloomberg nor Bloomberg's licensors approves or endorses this material, or guarantees the accuracy or completeness of any information herein, or makes any warranty, express or implied, as to the results to be obtained therefrom and, to the maximum extent allowed by law, neither shall have any liability or responsibility for injury or damages arising in connection therewith.
Statements attributed to an individual represent the opinions of that individual as of the date published and do not necessarily reflect the opinions of Capital Group or its affiliates. This information is intended to highlight issues and should not be considered advice, an endorsement or a recommendation.
All Capital Group trademarks mentioned are owned by The Capital Group Companies, Inc., an affiliated company or fund. All other company and product names mentioned are the property of their respective companies.
Use of this website is intended for U.S. residents only. Use of this website and materials is also subject to approval by your home office.
Advisory services offered through Capital Research and Management Company (CRMC) and its RIA affiliates.
This content, developed by Capital Group, home of American Funds, should not be used as a primary basis for investment decisions and is not intended to serve as impartial investment or fiduciary advice.
© 2025 Morningstar, Inc. All Rights Reserved. Some of the information contained herein: (1) is proprietary to Morningstar and/or its content providers; (2) may not be copied or distributed; and (3) is not warranted to be accurate, complete or timely. Neither Morningstar, its content providers nor Capital Group are responsible for any damages or losses arising from any use of this information. Past performance is no guarantee of future results. Information is calculated by Morningstar. Due to differing calculation methods, the figures shown here may differ from those calculated by Capital Group.

Important note: Compared to managed ladders, fully actively managed portfolios seek to generate returns in additional ways. The risks entailed are, therefore, potentially broader than investors might be exposed to in a ladder. Investors should consult with their financial advisors about the potential tax and risk consequences of different investment vehicles.
 

The Bloomberg Municipal Bond Index TR USD is a market-value-weighted index designed to represent the long-term investment-grade tax-exempt bond market. The Bloomberg Municipal Long 22+ Yr TR USD is the Long Bond (22+) component of the Bloomberg Municipal Bond Index. The Bloomberg Municipal 20 Yr 17-22 TR USD is the 20 Year (17-22) component of the Bloomberg Municipal Bond Index. The Bloomberg Municipal 15 Yr 12-17 TR USD is the 15 Year (12-17) component of the Bloomberg Municipal Bond Index. The Bloomberg Municipal 10 Yr 8-12 TR USD is the 10 Year (8-12) component of the Bloomberg Municipal Bond Index. The Bloomberg Municipal 7 Yr 6-8 TR USD is the 7 Year (6-8) component of the Bloomberg Municipal Bond Index. The Bloomberg Municipal 5 Yr 4-6 TR USD is the 5 Year (4-6) component of the Bloomberg Municipal Bond Index. The Bloomberg Municipal 3 Yr 2-4 TR USD is the 3 Year (2-4) component of the Bloomberg Municipal Bond Index. The Bloomberg Municipal 1 Yr 1-2 TR USD is the 1 Year (1-2) component of the Bloomberg Municipal Bond Index.
 

BVAL Muni Benchmark 1Y (1 year), BVAL Muni Benchmark 3Y (3 year), BVAL Muni Benchmark 5Y (5 year), and BVAL Muni Benchmark 7Y (7 year). The curve is the baseline curve for BVAL tax-exempt munis. It is populated with high quality US municipal bonds with an average rating of AAA from Moody's and S&P. The yield curve is built using non-parametric fit of market data obtained from the Municipal Securities Rulemaking Board, new issues calendars, and other proprietary contributed prices. Represents 5% couponing. Index names/tickers ending in T or Y (e.g., BVMB10T, BVMB10Y) are based off a rolling tenor.