info
Some of our associates in Southern California are affected by the widespread wildfires. We are focused on ensuring that our associates who live in evacuation zones are safe and are saddened by the devastating impact to our Los Angeles communities. At this time, all of our offices are open and all investment operations are running normally. We will update this notice if needed, but we are confident that we will not experience any business impact from the wildfires.

Bonds have offered balance amid fresh equity volatility
KEY TAKEAWAYS
  • While equities were battered in the recent round of volatility, bonds gained and appeared to resume their traditional role of providing ballast.
  • With inflation coming under control and a potential shift in the rate cycle, bonds are now in a position to offer cushion against equity market volatility.
  • It may be a good time for investors to reevaluate their portfolio’s bond exposure both in terms of overall allocation and within fixed income sectors.

The U.S. stock market neared correction territory in early August 2024 as a red-hot streak for equities appeared to finally cool. The S&P 500 Index tumbled 6.1% over a three-day period, including its largest one-day drop in nearly two years, and pushed losses to 7.9% since mid-July. The selloff was preceded by a variety of factors ranging from Japanese central bank actions that stoked investor anxiety to weakness in labor markets that heightened fears of a potential recession. Volatility, as measured by the Cboe Volatility Index (VIX), reached its highest level since 2020 as investors shed exposure to riskier assets.


Amid the headlines of the volatile period, there is one factor that we believe will be very important for investors to note: while equities were battered, bonds gained. 


The Bloomberg U.S. Aggregate Index, a benchmark for the U.S. investment-grade taxable bond market, returned 1.53% during the three-day period when stocks tumbled, helping to push the index’s returns to 2.6% since mid-July. While this period was admittedly short-lived, the gains contrasted with what investors experienced in 2022. At that time, the Federal Reserve’s rate-hiking campaign starting from historic low levels inflicted steep losses on fixed income, which also sent equity markets reeling. Bonds fell in tandem with stocks and left some investors questioning the value of a traditional 60/40 portfolio (shorthand for a diversified portfolio built with 60% equities and 40% fixed income). 
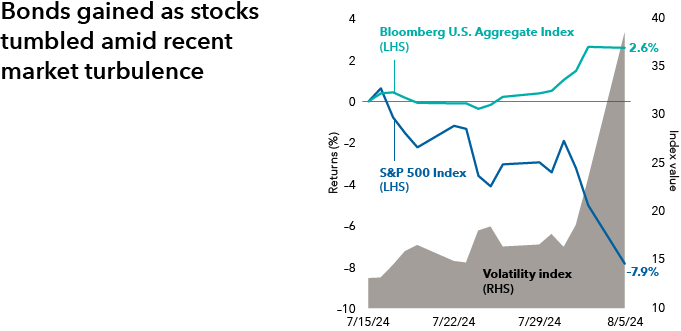

The chart shows returns for the S&P 500 Index and Bloomberg U.S. Aggregate Index on the left-hand side and the Volatility Index on the right-hand side, from July 15, 2024, to August 5, 2024. The y-axis for returns ranges from -10% to 4%. The y-axis for index value ranges from 10 to 40. The S&P 500 Index started at 0% and ended with a -7.9% return, while the Bloomberg U.S. Aggregate Index also started at 0% and concluded with a 2.6% return. The Volatility Index began at 13.12 and increased to 38.57, indicating a rise in market volatility during the period.

Source: Bloomberg. Data as of 8/5/24. Volatility index is represented by the Cboe Volatility Index (VIX), which is designed to produce a measure of constant, 30-day expected volatility of the U.S. stock market, based on S&P 500 Index call and put options. A higher VIX index level indicates higher volatility. 

But as stocks faced down this latest selloff, high-quality bonds appeared to resume their traditional role of providing ballast. Higher inflation and aggressive Fed rate hikes are what drove bond yields higher – with the 10-year Treasury yield peaking near 5% in October 2023 - providing ample room for yields to fall and for bond prices to appreciate. Inflation coming under control and the end of Fed rate hikes provided the backdrop for the traditional, negative correlation between stocks and bonds to be restored.


While this result might feel very different from what happened in 2022, seasoned investors may feel some relief seeing a return of the traditional relationship between stocks and bonds. With the potential shift in the rate cycle, bonds are now in a position to offer cushion against equity market volatility. The Fed has ammunition to fight recession in the form of cutting its target policy rate. And it has ample room to cut: The fed funds rate, which sits at 5.25% to 5.5%, is at a much higher level than investors have become accustomed to over the past 15 years. Fed chair Jerome Powell has signaled that rate cuts could come as soon as September. 
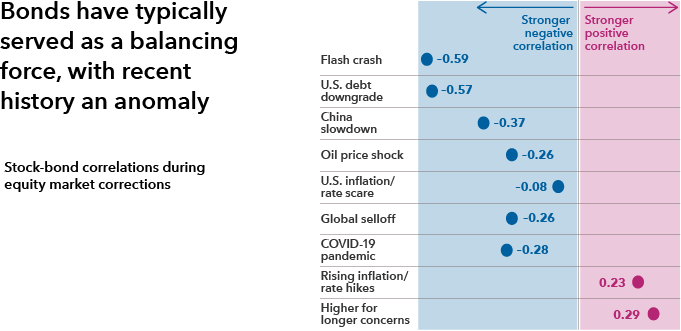

This chart shows the stock-bond correlation during equity market corrections. The chart lists nine equity correction periods alongside their correlation figures, which range from -0.59 to 0.29. The correlations for the corrections are as follows: Flash crash: –0.59; U.S. debt downgrade: –0.57; China slowdown: –0.37; Oil price shock: –0.26; U.S. inflation/rate scare: –0.08; Global selloff: –0.26; COVID-19 pandemic: –0.28; Historic inflation and rate hikes: 0.23; Higher for longer concerns: 0.29.

Source: Morningstar. As of 2/21/24. Correlation is a statistic that measures the degree to which two variables move in relation to each other; a positive correlation implies that they move together in the same direction while a negative correlation implies that they move in opposite directions. Correlation figures based on returns data for the S&P 500 Index versus the Bloomberg U.S. Aggregate Index. Correlation shown for the nine equity market correction periods since 2010. Corrections are based on price declines of 10% or more (without dividends reinvested) in the unmanaged S&P 500 with at least 75% recovery. Dates for correction periods are as follows: Flash crash, 4/24/10 to 7/2/10. U.S. debt downgrade: 5/2/11 to 10/3/11. China slowdown: 5/22/15 to 8/25/15. Oil price shock: 11/4/15 to 2/11/16. U.S. inflation/rate scare: 1/27/18 to 2/8/18. Global selloff: 9/21/18 to 12/24/18. COVID-19 pandemic: 2/20/20 to 3/23/20. Historic inflation and rate hikes: 1/4/22 to 10/12/22. Higher for longer concerns: 8/1/23 to 10/27/23.

Now may be a good time for investors to reevaluate their portfolio’s bond exposure both in terms of overall allocation and within fixed income sectors. During equity correction periods excluding recent losses driven by rising bond yields, high-quality fixed income with intermediate duration, a measure of interest rate exposure, has provided diversification from equities. This is evidenced by the low or negative correlation of the Bloomberg U.S. Aggregate Index to equities during these periods. In contrast to bonds, cash-like investments face reinvestment risk (meaning the potential inability to find a comparable rate of return elsewhere) rather than offering capital appreciation potential when rates fall.


Investors looking for a bond allocation that seeks to serve as a shock absorber for equity volatility should consider pursuing a true core bond fund or a high-quality core plus fund. The Bond Fund of America® (BFA) and American Funds Strategic Bond Fund (SBF) have provided strong diversification from equities. When looking at the recent period of volatility, from mid-July to early August, BFA and SBF have posted returns that outstripped average returns on the Morningstar Intermediate Core-Plus Bond category (core-plus category) by 26 and 89 basis points (bps), respectively. The category is comprised of some core plus strategies which may try to boost income or returns by taking on additional credit risk. Meanwhile CGCB - Capital Group Core Bond ETF, an active ETF launched in 2023, posted excess returns relative to the core-plus category of 48 bps during that timeframe. When looking at equity correction periods since 2010, BFA and SBF also had strong average excess returns over the core-plus category. 
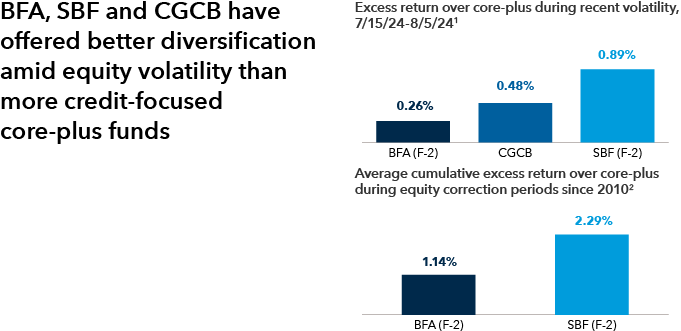

The top chart shows excess returns over core-plus during the recent volatility period, from 7/15/24 to 8/5/24, with BFA F-2 shares posting excess returns of 0.26%, CGCB posting excess returns of 0.48% and SBF F-2 shares posting excess returns of 0.89%. The bottom charts shows average cumulative excess return over core-plus during equity correction periods since 2010, with BFA F-2 shares posting excess returns of 1.14% and SBF F-2 shares posting excess returns of 2.29%.

Sources: Capital Group, Morningstar. Data as of 8/6/2024.

1Excess returns calculated relative to the Morningstar Intermediate Core-Plus Bond category, which returned 2.06% during the period. The S&P 500 index lost 7.6% over the period.

2Averages were calculated by using the cumulative returns of funds versus the Morningstar Intermediate Core-Plus Bond category during the nine equity market correction periods since 2010, except for SBF - the calculation for which only includes five periods after its March 2016 inception. CGCB is excluded from the chart as it hasn’t experienced a full correction period since its September 2023 inception. Corrections are based on price declines of 10% or more (without dividends reinvested) in the unmanaged S&P 500 with at least 75% recovery. The cumulative returns are based on total returns. Ranges of returns for the equity corrections measured: The Bond Fund of America: -14.07% to 3.41%; American Funds Strategic Bond Fund: -14.46% to 3.04%; Morningstar Intermediate Core-Plus Bond category: -14.73% to 2.25%; S&P 500 Index: -33.79% to -9.94%. There have been periods when the funds have lagged the categories and the index, such as in rising equity markets. 

Fixed income has historically served the role of helping to protect portfolios against equity market turmoil. Following the Fed’s historic rate hiking campaign, bonds once again appear poised to offer diversification and balance. Higher starting yields and the prospect of rate cuts means bonds are acting like bonds again, providing a measure of stability during uncertain times.


Figures shown are past results and are not predictive of results in future periods. Current and future results may be lower or higher than those shown. Investing for short periods makes losses more likely. Prices and returns will vary, so investors may lose money. View mutual fund expense ratios and returns. View ETF expense ratios and returns. View current mutual fund SEC yields.
Market price returns are determined using the official closing price of the fund's shares and do not represent the returns you would receive if you traded shares at other times.
Investments are not FDIC-insured, nor are they deposits of or guaranteed by a bank or any other entity, so they may lose value.
Investors should carefully consider investment objectives, risks, charges and expenses. This and other important information is contained in the fund prospectuses and summary prospectuses, which can be obtained from a financial professional and should be read carefully before investing.
Capital Group exchange-traded funds (ETFs) are actively managed and do not seek to replicate a specific index. ETF shares are bought and sold through an exchange at the then current market price, not net asset value (NAV), and are not individually redeemed from the fund. Shares may trade at a premium or discount to their NAV when traded on an exchange. Brokerage commissions will reduce returns. There can be no guarantee that an active market for ETFs will develop or be maintained, or that the ETF's listing will continue or remain unchanged.
The use of derivatives involves a variety of risks, which may be different from, or greater than, the risks associated with investing in traditional securities, such as stocks and bonds.
Lower rated bonds are subject to greater fluctuations in value and risk of loss of income and principal than higher rated bonds.
The return of principal for bond portfolios and for portfolios with significant underlying bond holdings is not guaranteed. Investments are subject to the same interest rate, inflation and credit risks associated with the underlying bond holdings.
Frequent and active trading of American Funds Strategic Bond Fund's portfolio securities may occur, which may involve correspondingly greater transaction costs, adversely affecting the results.
Investing outside the United States involves risks, such as currency fluctuations, periods of illiquidity and price volatility. These risks may be heightened in connection with investments in developing countries.
Nondiversified funds have the ability to invest a larger percentage of assets in the securities of a smaller number of issuers than a diversified fund. As a result, poor results by a single issuer could adversely affect fund results more than if the fund invested in a larger number of issuers. See the applicable prospectus for details.
There have been periods when the results lagged the index(es) and/or average(s). The indexes are unmanaged and, therefore, have no expenses. Investors cannot invest directly in an index.
Source: Bloomberg Index Services Limited. BLOOMBERG® is a trademark and service mark of Bloomberg Finance L.P. and its affiliates (collectively "Bloomberg"). Bloomberg or Bloomberg's licensors own all proprietary rights in the Bloomberg Indices. Neither Bloomberg nor Bloomberg's licensors approves or endorses this material, or guarantees the accuracy or completeness of any information herein, or makes any warranty, express or implied, as to the results to be obtained therefrom and, to the maximum extent allowed by law, neither shall have any liability or responsibility for injury or damages arising in connection therewith.
Each S&P Index ("Index") shown is a product of S&P Dow Jones Indices LLC and/or its affiliates and has been licensed for use by Capital Group. Copyright © 2025 S&P Dow Jones Indices LLC, a division of S&P Global, and/or its affiliates. All rights reserved. Redistribution or reproduction in whole or in part is prohibited without written permission of S&P Dow Jones Indices LLC.
All Capital Group trademarks mentioned are owned by The Capital Group Companies, Inc., an affiliated company or fund. All other company and product names mentioned are the property of their respective companies.
Investment results assume all distributions are reinvested and reflect applicable fees and expenses.
Certain share classes were offered after the inception dates of some funds. Results for these shares prior to the dates of first sale are hypothetical based on the original share class results without a sales charge, adjusted for typical estimated expenses. 
  • Class F-2 shares were first offered on 8/1/2008.
Results for certain funds with an inception date after the share class inception also include hypothetical returns because those funds' shares sold after the funds' date of first offering. View dates of first sale and specific expense adjustment information.
Use of this website is intended for U.S. residents only.
Capital Client Group, Inc.
This content, developed by Capital Group, home of American Funds, should not be used as a primary basis for investment decisions and is not intended to serve as impartial investment or fiduciary advice.
© 2025 Morningstar, Inc. All Rights Reserved. Some of the information contained herein: (1) is proprietary to Morningstar and/or its content providers; (2) may not be copied or distributed; and (3) is not warranted to be accurate, complete or timely. Neither Morningstar, its content providers nor Capital Group are responsible for any damages or losses arising from any use of this information. Past performance is no guarantee of future results. Information is calculated by Morningstar. Due to differing calculation methods, the figures shown here may differ from those calculated by Capital Group.

For CGCB, the use of derivatives involves a variety of risks, which may be different from, or greater than, the risks associated with investing in traditional securities, such as stocks and bonds.

For CGCB, lower rated bonds are subject to greater fluctuations in value and risk of loss of income and principal than higher rated bonds.

For CGCB, the return of principal for bond funds and for funds with significant underlying bond holdings is not guaranteed. Fund shares are subject to the same interest rate, inflation and credit risks associated with the underlying bond holdings.

For CGCB, investing outside the United States involves risks, such as currency fluctuations, periods of illiquidity and price volatility. These risks may be heightened in connection with investments in developing countries.

The Bloomberg U.S. Aggregate Index measures the performance of the investment-grade, USD-denominated, fixed-rate taxable bond market.

The S&P 500 Index is a market capitalization-weighted index based on the results of approximately 500 widely held common stocks.