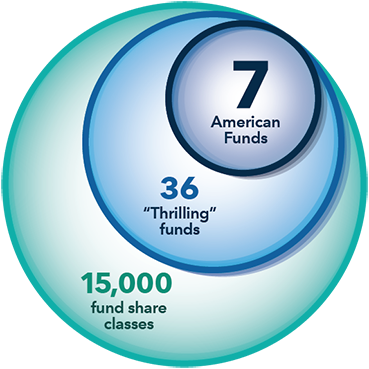
7 American Funds deemed “Thrilling” by Morningstar
Here are some simple metrics that can help winnow the field

1. Risk and return

2. Upside and downside

3. Glide path

4. Expenses

5. Management
1. What is the return for the level of risk?
Market downturns can be devastating to target date fund participants in the years surrounding the retirement date when participants need to preserve wealth. So, identifying a target date fund that has provided solid results with low volatility could help protect investors from inopportune downturns. But keep in mind, although target date portfolios are managed on a projected retirement time frame, the allocation strategy does not guarantee that investors' retirement goals will be met.
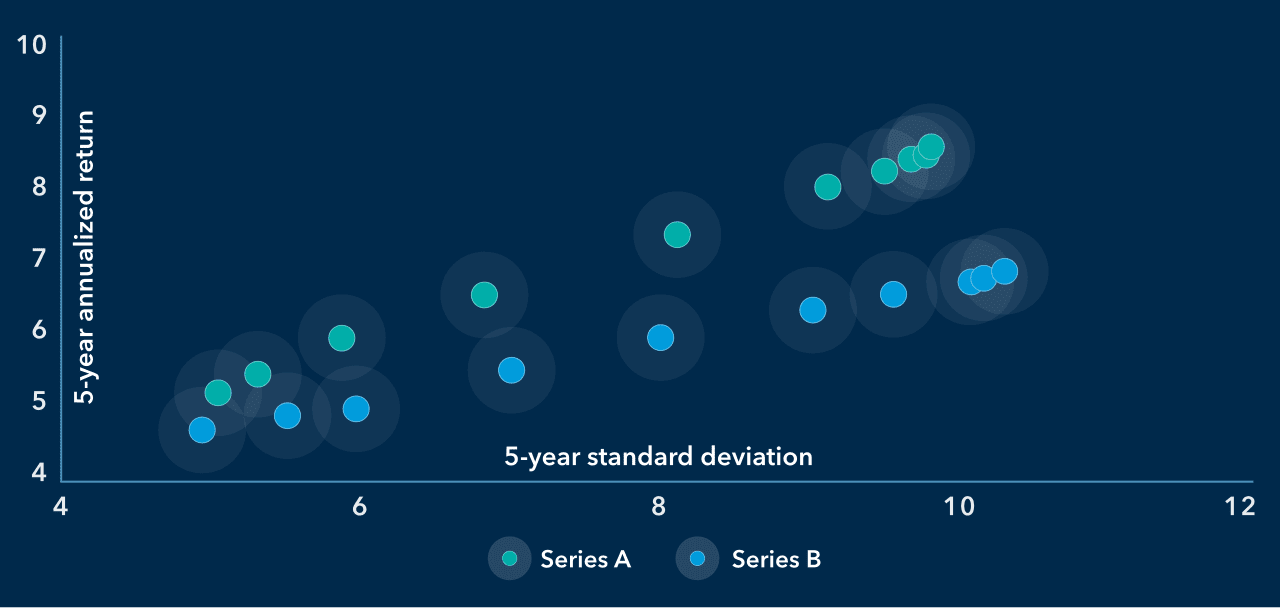
The following two hypothetical target date series have similar risk levels across vintages (as measured by standard deviation), but series A had a significantly higher annual return at each level of risk taken.
How has the series balanced risk and return?
Returns per standard deviation for two hypothetical target date series.

Hypothetical results are for illustrative purposes only and in no way represent the actual results of a specific investment. Standard deviation is a measure of how returns over time have varied from the mean and is one of the most common measures of absolute volatility. A lower number signifies lower volatility.
2. How has the series navigated the upside and downside?
A more specific sense of how a target date series has held up against its peers in both up and down markets can come from a fund’s upside and downside capture ratios.
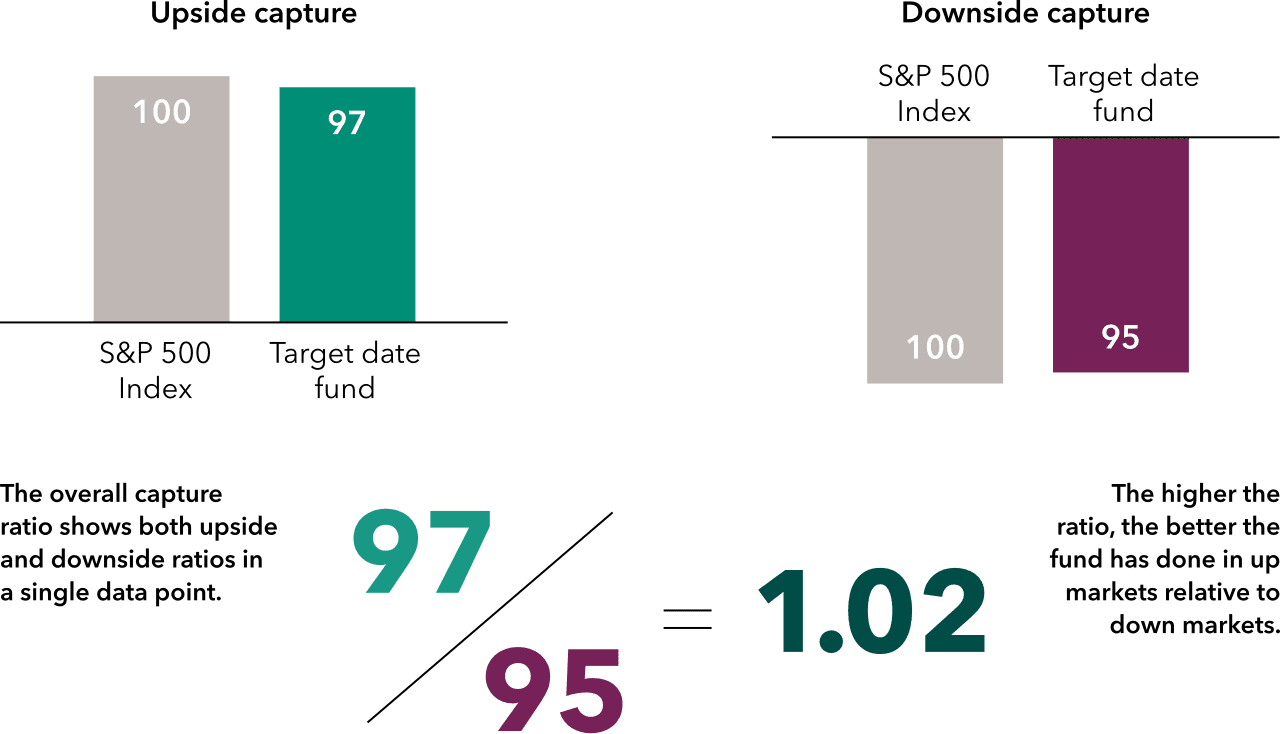
Upside and downside capture ratios measure how well a fund did relative to a passive index (like the S&P 500) when markets rose or fell. An upside capture of >1.0 indicates the fund captured more of the upside than the index, while a downside capture of <1.0 indicates less decline.
There is a metric we believe reveals how well a series has managed that trade-off: the overall capture ratio. This ratio is calculated by dividing a fund’s upside capture by its downside capture.
The unsung metric: Overall capture
A higher ratio means that a fund’s upside has tended to exceed its downside.

This example is hypothetical and for illustrative purposes only.
3. How is the glide path managed?
The glide path is what sets the target date apart as an investment vehicle — and what drives its simplicity for participants. It is also one of the more challenging things to evaluate when selecting a series.
To or through?
There are two types of glide paths: a “to” glide path, where the fund reaches its most conservative allocation at the year of retirement, and a “through” glide path, where the equity portion of the fund is systematically tapered off over a period of up to 30 years after the retirement date. A “to” series more accurately reflects the current reality where most target date participants exit the plan when they retire and roll their target date over into an individual retirement account. However, we believe that more participants in the future will choose to remain in the plan’s target date fund — as the extended growth trajectories of “through” series become more widely understood.
What types of equity?
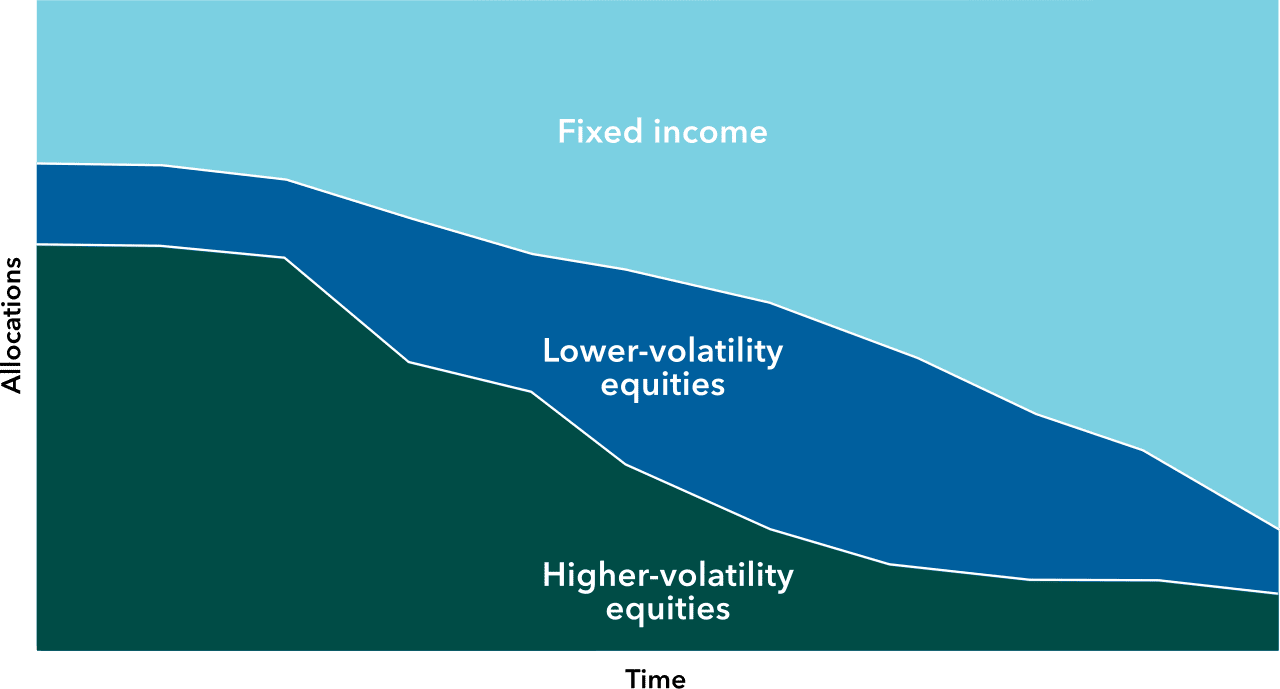
How much equity a target date series has near the retirement date matters for participants because equity exposure often is the biggest source of volatility in a glide path. But the types of equities matter, too, as not all equities are equally volatile. Does the series shift to historically less volatile equities as investors age? How much of the equity near retirement is in less volatile vs. more volatile types of securities and/or markets? For example, is the equity near retirement growth-oriented or focused more on defensive, dividend-paying equities that have tended to do better when markets decline?
Not all equities are equal
Dividend-paying stocks may reduce volatility when participants are more vulnerable.

4. Are the returns worth the expenses?
Expenses clearly matter as they directly reduce the returns participants receive. End results (which factor in the fees) matter more, however, as that’s what determines participant outcomes. To weigh both cost and potential return, plot target date funds’ expense ratios against their annualized returns — so you can incorporate both value and cost into the selection process.
5. What is the quality of management?
When choosing a target date series, the quality and experience of portfolio managers is arguably the most critical consideration.
Here are some areas we think merit a close look:
Experience — How long have target date managers been in the industry? What are their professional backgrounds? Do they bring a mix of equity, fixed income and multi-asset experience?
Personal ownership — Are the series’ managers personally invested in their target date series? High manager ownership is a sign of managers’ conviction, as it means they share in participants’ investment gains and losses. This information is typically published by Morningstar and in a fund’s SEC-required Statement of Additional Information (SAI), which typically is available on an asset manager’s website.

