Markets & Economy
Bonds
The path to higher interest rates is painful, but it should ultimately benefit bond investors over the long haul.
The U.S. Federal Reserve raised its benchmark policy rate by 0.75% to 1.50%–1.75%, the biggest increase since 1994. The central bank also signaled an additional 1.75% of increases ahead. Policymakers specifically raised the median year-end projection for the Fed funds rate to a range between 3.25% and 3.50%.
U.S. bonds have tumbled more than 10% so far this year, but there are signs the worst may be over. Investors have several reasons to own bonds as the Fed attempts to steer the economy toward a much-debated soft landing.
1. Big declines may bring opportunities
Bond investors have snapped up debt as prices declined sharply on fears the Fed’s effort to tame inflation could severely strain economic growth. The buying spree helped most bond sectors post positive returns in May.
Questions that drove volatility remain, but now may be an opportune time to turn anxiety into action. “Equity market swings will likely continue, but bond markets are unlikely to decline another 10% from here,” says Ritchie Tuazon, portfolio manager for American Funds Strategic Bond FundSM.
The downward selling pressure has brought valuations for most bonds back to Earth and more in line with expectations. This may provide an attractive entry point for investors.
Exposure to high-quality bond funds can again offer the diversification investors want, especially amid heightened equity volatility. Investors can also seek opportunities across bond sectors to achieve investment goals such as income and inflation protection.
2. Current bond yields largely account for inflation-driven rate hikes
The Fed’s rate hikes and balance sheet reductions suggest a focus on bringing down inflation. But there is still work to do.
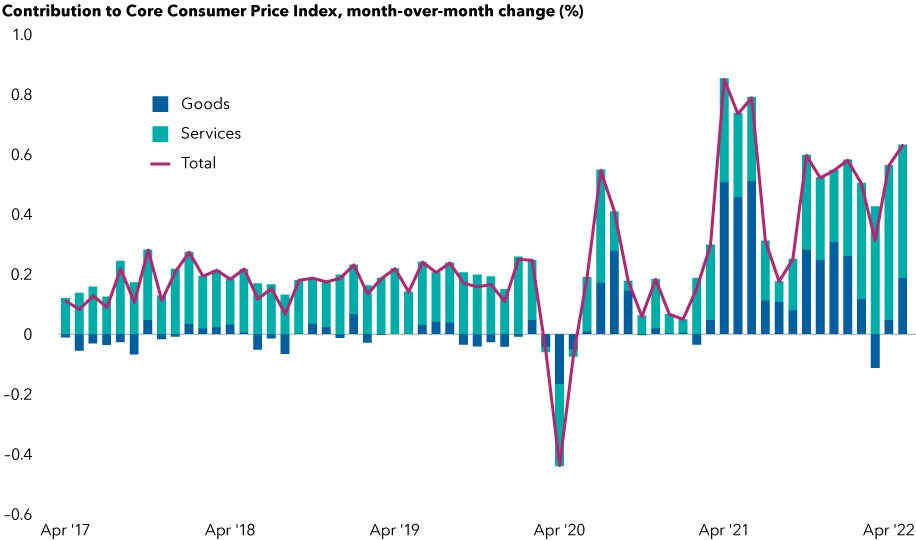
The consumer price index jumped 8.6% for the year through May and is up 1% from April. Core inflation, which excludes food and energy, rose 0.6% from the prior month.
Prices for services soar, which may be harder to tame

Source: U.S. Bureau of Labor Statistics. As of 5/31/2022.
The overall number is worrisome. “I think the Fed is still behind the curve on rate hikes,” Tuazon adds.
Prices likely peaked for some items that surged in demand during COVID lockdowns. Case in point: Lumber prices jumped alongside home sales and renovations during the pandemic but have slid 50% from the start of the year. However, prices for services and necessities such as food, housing and energy have skyrocketed. “It may be a case of one replacing the other, keeping inflation high,” Tuazon notes.
Persistent inflation may force the Fed to revise its rates path higher. However, since investors have mostly priced bonds to account for the more aggressive plan, future adjustments are unlikely to result in as much bond market turmoil.
Over the next year, bond yields are less likely to climb as much as they have since July 2021, when markets began to worry about elevated inflation.
Treasury yield expectations show rate hikes are largely priced in

Source: Bloomberg. As of 6/15/2022.
3. Income is back in fixed income
Investors may soon be able to cash in on higher rates.
The yield on the 10-year U.S. Treasury hit 3.48% in mid-June, the highest close since April 2011. Yields, which rise when bond prices fall, have jumped across bond sectors. Over time, rising yields mean more income from bonds.
Income opportunity in bonds is the brightest in years

Sources: Bloomberg, Bloomberg Index Services Ltd., J.P. Morgan, Federal Reserve. As of 6/15/22. Sector yields above include Bloomberg U.S. Aggregate Index, Bloomberg U.S. Corporate Investment Grade Index, Bloomberg U.S. Corporate High Yield Index, 50% J.P. Morgan EMBI Global Diversified Index/50% J.P. Morgan GBI-EM Global Diversified Index blend and Bloomberg Municipal Bond Index. Period of time considered from 2020 to present. Dates for lows from top to bottom in chart shown are: 8/4/20, 12/31/20, 7/6/21, 1/4/21 and 7/27/21.
There are still pitfalls ahead, so an active approach might help. While a recession does not appear imminent, credit spreads may widen as investors forecast the likelihood of one, says Tara Torrens, portfolio manager for American High-Income Trust®.
Certain industries that are defensive in nature, such as health care and food, may offer more value in this environment. Commodities companies can also offer refuge in a late-cycle period. “There are always opportunities, but I’m maintaining a lot of liquidity that could then be redeployed if we see the type of spread widening that I’m expecting,” Torrens says.
Emerging markets debt — a corner of the bond market that has been especially volatile — offers some opportunities as well. Several countries have raised rates ahead of the Fed and are on good financial footing, according to American Funds Emerging Markets Bond Fund® portfolio manager Rob Neithart. Given the nuances of emerging markets investing, an active approach can help steer investors toward select investment ideas.

Midyear Outlook webinar
Watch it on demand
CE credit available
Now may also be a good time for investors to start examining their allocation to tax-exempt muni bonds, says Chad Rach, a portfolio manager for American High-Income Municipal Bond Fund®. This is particularly true for investors who came into the recent bond rout with limited exposure to bonds.
Munis fell out of favor with the rest of the fixed income market as yields rose in response to inflation and the Fed. This has radically improved absolute rates and credit spreads, and some muni managers have dipped back in. “High-yield muni credit fundamentals are strong across nearly all relevant sectors, and valuations are starting to make the risk/reward relationship much more favorable than any time since the pandemic hit,” Rach says.
4. Current yields have delivered attractive returns
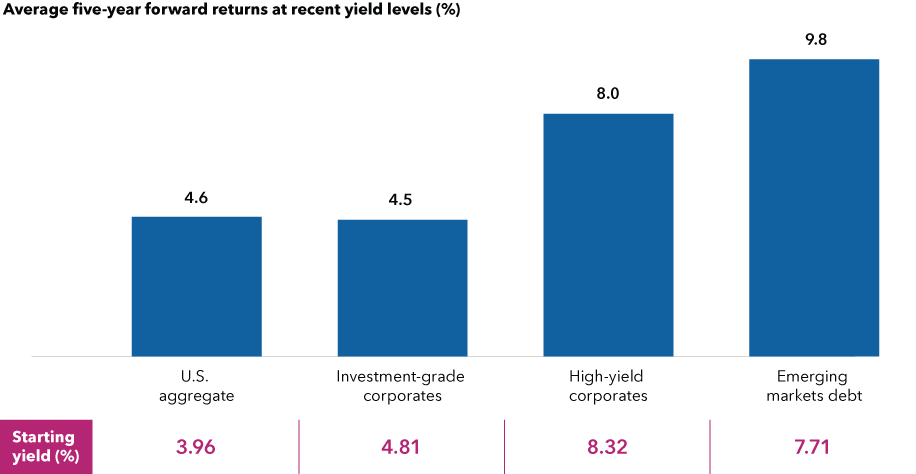
At today’s yields, history suggests higher total returns in the future. This means that investors could benefit from holding bonds across fixed income asset classes, including high yield.
Higher yields have boosted total returns

Sources: Capital Group, Bloomberg, J.P. Morgan. Yields as of June 15, 2022. Monthly return data as of May 31, 2022, going back to January 2000, for all sectors except for emerging markets debt, which goes back to January 2003. Based on average monthly returns for each sector when in a +/–0.30% range of yield-to-worst shown. Sector yields above include Bloomberg U.S. Aggregate Index, Bloomberg U.S. Investment Grade Corporate Index, Bloomberg U.S. Corporate High Yield Index, 50% J.P. Morgan EMBI Global Diversified Index/50% J.P. Morgan GBI-EM Global Diversified Index blend. Past results are not predictive of results in future periods.
“Average annual returns for the high-yield market historically are approximately 6% to 8%. We are again at a starting yield level where these returns could be achieved, with a multi-year investment horizon, which is the first time this has been true in a while,” Torrens says.
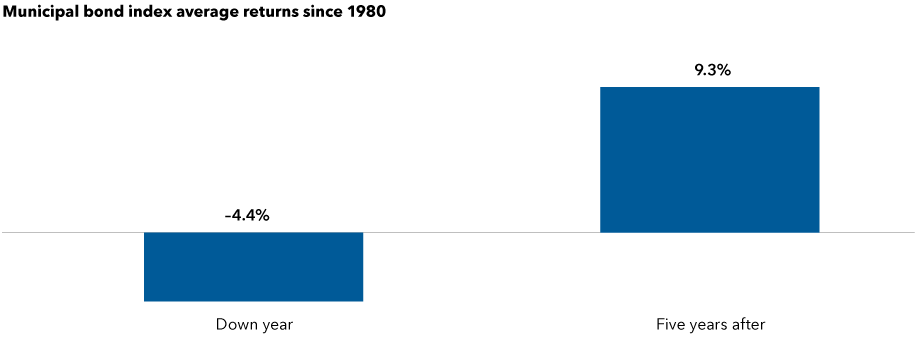
A similar story plays out for muni bonds, Rach says. In years when munis were down, they averaged a loss of about 4.4%. However, in the five-year period that followed, the sector saw an average annualized return of 9.3%.
Munis are popular with affluent investors because of their federal tax-exempt status. For those in the highest tax bracket, income potential in both investment-grade and high-yield muni sectors exceeds that of their taxable counterparts. Munis also historically have a lower risk of default compared to similarly rated companies.
History suggests higher muni returns ahead

Sources: Capital Group, Bloomberg. Returns as of June 15, 2022. Past results are not predictive of results in future periods.
Why own bonds now?
Investors have a lot to be pessimistic about: war in Ukraine, inflation and fears of a looming recession. Big declines occurred as investors feared the Fed could crimp growth as it raises rates and ends its asset purchases.
Although risks remain, bond investors have largely priced in rate hikes. Now could be an attractive entry point, particularly for those using bonds to buffer equity volatility.
“There’s a lot to be positive about despite all the negative headlines,” Tuazon says. “While past results are no guarantee of future outcomes, a long-term perspective can help investors recognize that yields at current levels have historically delivered more income and attractive returns.”
The return of principal for bond funds and for funds with significant underlying bond holdings is not guaranteed. Fund shares are subject to the same interest rate, inflation and credit risks associated with the underlying bond holdings. Lower rated bonds are subject to greater fluctuations in value and risk of loss of income and principal than higher rated bonds. Income from municipal bonds may be subject to state or local income taxes and/or the federal alternative minimum tax. Certain other income, as well as capital gain distributions, may be taxable. While not directly correlated to changes in interest rates, the values of inflation linked bonds generally fluctuate in response to changes in real interest rates and may experience greater losses than other debt securities with similar durations. The use of derivatives involves a variety of risks, which may be different from, or greater than, the risks associated with investing in traditional cash securities, such as stocks and bonds. Bond ratings, which typically range from AAA/Aaa (highest) to D (lowest), are assigned by credit rating agencies such as Standard & Poor's, Moody's and/or Fitch, as an indication of an issuer's creditworthiness. If agency ratings differ, the security will be considered to have received the highest of those ratings, consistent with the fund's investment policies.
The indexes are unmanaged and, therefore, have no expenses. Investors cannot invest directly in an index.
Bloomberg U.S. Aggregate Index represents the U.S. investment-grade fixed-rate bond market.
Bloomberg U.S. Corporate High Yield Index covers the universe of fixed-rate, non-investment-grade debt.
Bloomberg U.S. Corporate Investment Grade Index represents the universe of investment grade, publicly issued U.S. corporate and specified foreign debentures and secured notes that meet the specified maturity, liquidity and quality requirements.
Bloomberg Municipal Bond Index is a market value-weighted index designed to represent the long-term investment-grade tax-exempt bond market.
The J.P. Morgan Emerging Market Bond Index (EMBI) Global Diversified is a uniquely weighted emerging market debt benchmark that tracks total returns for U.S. dollar-denominated bonds issued by emerging market sovereign and quasi-sovereign entities. J.P. Morgan Government Bond Index — Emerging Markets (GBI-EM) Global Diversified covers the universe of regularly traded, liquid fixed-rate, domestic currency emerging market government bonds to which international investors can gain exposure. The 50%/50% J.P. Morgan EMBI Global/J.P. Morgan GBI-EM Global Diversified blends the J.P. Morgan EMBI Global Index with the J.P. Morgan GBI-EM Global Diversified Index by weighting their cumulative total returns at 50% each. This assumes the blend is rebalanced monthly.
BLOOMBERG® is a trademark and service mark of Bloomberg Finance L.P. and its affiliates (collectively “Bloomberg”). Bloomberg or Bloomberg’s licensors own all proprietary rights in the Bloomberg Indices. Neither Bloomberg nor Bloomberg’s licensors approves or endorses this material, or guarantees the accuracy or completeness of any information herein, or makes any warranty, express or implied, as to the results to be obtained therefrom and, to the maximum extent allowed by law, neither shall have any liability or responsibility for injury or damages arising in connection therewith.
This report, and any product, index or fund referred to herein, is not sponsored, endorsed or promoted in any way by J.P. Morgan or any of its affiliates who provide no warranties whatsoever, express or implied, and shall have no liability to any prospective investor, in connection with this report. J.P. Morgan disclaimer: https://www.jpmm.com/research/disclosures.
RELATED INSIGHTS
-
-
Asset Allocation
-
Never miss an insight
The Capital Ideas newsletter delivers weekly insights straight to your inbox.
 Ritchie Tuazon
 Chad Rach
 Tara Torrens