
TODAY’S CHALLENGE
CPI: 2.4% in March 2025*
Volatile markets and a cautious Federal Reserve create a need for careful positioning in fixed income markets.
CPI: 2.4% in March 2025*
50+ years of fixed income investing
OUR STRATEGY
50 years of fixed income investing
Capital Group offers bond funds to help investors generate meaningful income. Our research-driven, active approach allows for allocations to shift based on market conditions and investment insights (subject to fund guidelines).
*Source: Bureau of Labor Statistics. The U.S. Consumer Price Index (CPI) is a measure of the average change over time in the prices paid by urban consumers for a market basket of consumer goods and services.
OUR TAKE
On a historical basis, opportunities for high income should continue if the U.S. economy maintains its strength.
For investors willing to add risk, allocations to multisector, high yield or emerging markets debt funds can complement core funds and help provide income.
Income-seeking funds offered higher distributions, complemented core (F-2 shares)

AHMFX's tax-equivalent 30-day SEC yields (gross/net) for the F-2 share class at the highest federal tax rate were 7.47%/7.47% as of 5/31/25.
*Tax-equivalent 12-month distribution rate: Highest tax rate assumes the 3.8% Medicare tax and the top federal marginal tax rate for 2025 of 37%. Morningstar Intermediate Core Bond and Morningstar Intermediate Core-Plus Bond are category averages. Sources: Morningstar. Bloomberg.
American Funds Multi-Sector Income Fund (F-2)
MIAYX

American High-Income Trust (F-2)
AHIFX

American Funds Emerging Markets Bond Fund (F-2)
EBNFX

American High-Income Municipal Bond Fund (F-2)
AHMFX

Featured fund: American Funds Multi-Sector Income Fund
American Funds Multi-Sector Income Fund invests across higher income sectors. The fund is designed to provide less volatility than a standalone high-yield or emerging markets debt fund, without meaningfully reducing income.
-
-
Positioning
Fund tilted toward higher quality sectors
Monthly allocations since fund inception (March 22, 2019)
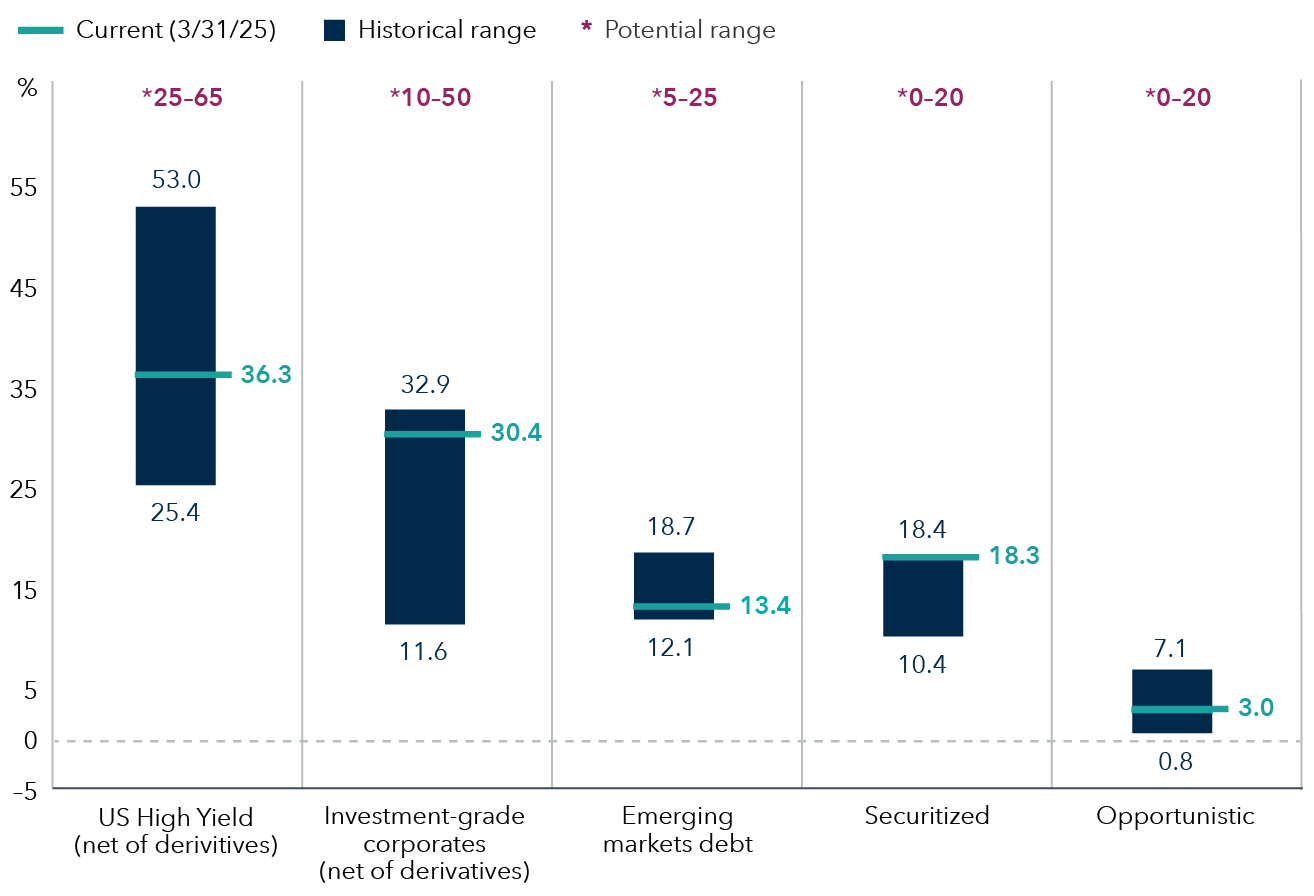
Opportunistic includes U.S. Treasuries, municipal bonds, noncorporate credit and other debt instruments. Securitized includes financial securities that are created by securitizing individual loans (debt). Source: Capital Group. Data as of 3/31/25. Investment-grade = BBB/Baa and above.
Overweight
Securitized
Securitized credit is still the fund's largest overweight conviction and remains toward the higher end of its historical allocation. The fund's commercial mortgage-backed securities allocation is relatively evenly split between conduit and single-asset/single-borrower issuers. Meanwhile, our strongest conviction within asset-backed securities continues to be subprime autos, and to a lesser extent, auto rentals.
Investment-grade credit
The fund modestly increased its allocation to investment-grade corporates as spread widening provided an opportunity for a small relative value shift in positioning. As compared to its custom benchmark, this increased allocation brought the investment-grade sector towards its neutral allocation, up from an underweight at year-end. We also increased our allocations to select technology and electricity issuers over the quarter.
Underweight
High yield
Given that our outlook for high yield and the U.S. economy remain generally positive, we increased our allocation to high-yield corporates via a combination of cash bonds and credit default swaps as spreads widened relative to investment-grade corporates over the quarter. Despite this increase in high yield, the fund is still underweight its blended benchmark, driven by our relative value view of the sector.
Emerging markets
The fund maintains its underweight to emerging markets debt. Still, this allocation benefits from significant yield from its overweight to higher-yielding below-investment-grade sovereigns and its underweight to lower-yielding investment-grade sovereigns, which appear rich relative to other investment-grade sectors. We believe EMD remains attractive on a risk-adjusted basis, with many emerging economies showing signs of decreasing inflation.
Weightings are relative to the American Funds Multi-Sector Income Fund Custom Index. As of 3/31/25.
-
Strategy
Credit selection remains key – Stable fundamentals support current valuations
- During the quarter, valuations drifted wider as a result of increased uncertainty around the breadth and impact of tariffs and how they will affect consumer sentiment and spending.
- Against a backdrop of healthy fundamentals and technicals, the fund modestly increased its allocation to high-yield corporates via credit default swaps as spreads widened off their tightest levels year-to-date.
- Overall, we expect U.S. economic growth to continue to be positive, albeit potentially slower. We also expect global growth to improve as a result of fiscal stimulus, the ReArm EU initiative and political dynamics that may lead to closer European integration. Still, we believe uncertainty will persist as a result of tariffs.
Source: Capital Group. As of 3/31/25.

-


Featured fund: American High-Income Trust
A diversified portfolio of lower rated, higher yielding bonds seeking to provide you with a high level of current income
Fund is slightly defensively positioned as growth moderates
Industries shown below are among the fund's notable overweights and underweights relative to the index

Sources: Capital Group, Bloomberg. Data as of 3/31/25.
Overweight
Energy
The sector's credit quality and cash flow have improved following two recent default cycles in 2015 and 2020. Fundamentals remain attractive even as U.S. and global economic growth may moderate.
Brokerage, asset managers & exchanges
Financial advisory platforms are growing via consolidation and should benefit from elevated interest rates. Investments across the sector have produced an attractive level of cash flow despite recent concerns about cash sweep considerations.
Underweight
Consumer cyclical
Although the fund remains broadly underweight the sector, we maintain idiosyncratic positions in retailers, gaming and leisure. These investments skew toward higher quality issues within these subsectors.
Capital goods
The fundamental outlook is stable across industries like diversified manufacturing. The largest underweight within the sector comes from building materials, which has been the most impacted by decreasing home sales in recent years.
Weightings are relative to the Bloomberg U.S. Corporate High Yield 2% Issuer Capped Index as of 3/31/25.
Some say
Bonds may be challenged as market volatility increases.
Insight
Historically, many fixed income sectors have produced above-average returns following the beginning of a rate-cutting cycle. With the Fed likely to continue cutting rates in 2025, we believe income-oriented sectors can effectively complement a core bond allocation.
In our view, high yield, emerging markets bonds, investment-grade corporates and other sectors can potentially enable income investors to achieve long-term excess returns even as interest rates fall.
Some say
Investors just need stocks, not bonds, for income
Insight
Investments in higher income bonds in addition to dividend-paying stocks can help income-seeking investors fund a longer retirement. Higher income bonds include investment-grade and high-yield corporates, emerging markets and securitized. In addition to diversification, most of these bonds offer steady coupon payments. However, they also carry the risk of defaulting on their obligations.
Depending on their circumstances, income-seeking investors may want to consider allocating a portion of their investments to these riskier assets.
Some say
Current high-yield spreads are tight versus their historical average
Insight
While it’s natural for fixed income investors to be concerned with tight spreads, indicators such as starting yield to worst (YTW), credit quality and the likely direction of U.S. corporate earnings suggest that high yield may continue to outpace other fixed income sectors in 2025. With a starting YTW of nearly 7.5% and with more than 50%* of the high-yield market rated BB/Ba, we believe high yield can continue to complement a core bond allocation and potentially offer greater long-term income than dividend-paying stocks.
Source: Bloomberg. Data as of 12/31/24. In this case, yield to worst is defined as the lowest possible yield that an investor would receive if all the issuers in a fixed income fund fulfilled their payment obligations. *Based on the Bloomberg U.S. High Yield 2% Issuer Capped Index.
Some say
Only speculative investors should buy emerging markets debt
Insight
Emerging markets bonds can offer high income with currency and geographic diversity.
Many emerging markets sovereign bonds are investment-grade-rated, and the asset class comprises some of the fastest growing economies in the world. Idiosyncratic and geopolitical risks tied to emerging markets are real, and a capable asset manager with risk-control processes in place is paramount.
Some say
Municipal bonds are only for wealthy investors
Insight
Investors across multiple tax brackets can benefit from allocations to municipal bonds. Munis are typically exempt from federal taxes, and sometimes state and local taxes, which means investors can keep more of their interest income.
Beyond tax advantages, munis are lower risk compared to high-yield bonds and equities. They can also serve to diversify your portfolio.
- The distribution rate reflects the fund's past dividends paid to shareholders and may differ from the fund's SEC yield which reflects the rate at which the fund is earning income on its current portfolio of securities. The distribution rate reflects fee waivers and/or expense reimbursements in effect during the period. Without waivers and/or reimbursements, it would be reduced. A portion of the fund's distribution may be classified as a return of capital. Please refer to the fund's Annual Report for details.
- Calculated by Morningstar. Due to differing calculation methods, the figures shown here may differ from those calculated by Capital Group.
- Expense ratios are as of each fund's prospectus/characteristics statement, as applicable, available at the time of publication.
4. Certain share classes were offered after the inception dates of some funds. Results for these shares prior to the dates of first sale are hypothetical based on the original share class results without a sales charge, adjusted for typical estimated expenses.
- Class F-2 were first offered on 8/1/2008.
Results for certain funds with an inception date after the share class inception also include hypothetical returns because those funds' shares sold after the funds' date of first offering. View dates of first sale and specific expense adjustment information.
Duration indicates a bond fund’s sensitivity to interest rates. Higher duration indicates more sensitivity.
Sharpe ratio uses standard deviation and excess return to determine reward per unit of risk. The higher the number, the better the portfolio's historical risk-adjusted performance.
Annualized standard deviation (based on monthly returns) is a common measure of absolute volatility that tells how returns over time have varied from the mean. A lower number signifies lower volatility.
Correlation to S&P 500 is a measurement of how returns for the fund and S&P 500 move in relation to each other.
Bloomberg U.S. Corporate Investment Grade Index represents the universe of investment grade, publicly issued U.S. corporate and specified foreign debentures and secured notes that meet the specified maturity, liquidity, and quality requirements. This index is unmanaged, and its results include reinvested distributions but do not reflect the effect of sales charges, commissions, account fees, expenses or U.S. federal income taxes.
Bloomberg U.S. Corporate High Yield 2% Issuer Capped Index covers the universe of fixed-rate, non-investment-grade debt. The index limits the maximum exposure of any one issuer to 2%. This index is unmanaged, and its results include reinvested distributions but do not reflect the effect of sales charges, commissions, account fees, expenses or U.S. federal income taxes.
American Funds Multi-Sector Income Fund Custom Index comprises: 45% Bloomberg U.S. Corporate High Yield 2% Issuer Capped Index, 30% Bloomberg U.S. Corporate Investment Grade Index, 15% J.P. Morgan EMBI Global Diversified Index, 8% Bloomberg CMBS Ex AAA Index, 2% Bloomberg ABS Ex AAA Index and blends the respective indices by weighting their cumulative total returns according to the weights described. This assumes the blend is rebalanced monthly.
J.P. Morgan Emerging Market Bond Index (EMBI) Global Diversified is a uniquely weighted emerging market debt benchmark that tracks total returns for U.S. dollar-denominated bonds issued by emerging market sovereign and quasi-sovereign entities. This index is unmanaged, and its results include reinvested dividends and/or distributions but do not reflect the effect of account fees, expenses or U.S. federal income taxes.
J.P. Morgan CEMBI Broad Diversified Index tracks the performance of US dollar-denominated bonds issued by emerging market corporate entities.
JP Morgan Government Bond Index – Emerging Markets Global Diversified covers the universe of regularly traded, liquid fixed-rate, domestic currency emerging market government bonds to which international investors can gain exposure. This index is unmanaged, and its results include reinvested dividends and/or distributions but do not reflect the effect of account fees, expenses or U.S. federal income taxes.
Bloomberg CMBS Ex AAA Index: tracks investment-grade (Baa3/BBB- or higher, excluding Aaa/AAA) commercial mortgage backed securities that are included in the Bloomberg U.S. Aggregate Index. These securities have a minimum life of at least one year and must be fixed-rated weighted average coupon or capped weighted average coupon securities.
Bloomberg ABS Ex AAA Index: covers fixed-rated investment-grade (Baa3/BBB- or higher, excluding Aaa/AAA) asset backed securities that are included in the Bloomberg U.S. Aggregate Index. The index has three subsectors, which includes credit and charge cards, autos, and utility. These securities are ERISA-eligible and must have an average life of at least one year and must be senior class, tranche B or C of the deal.
The after-tax (or tax-equivalent) yield of a municipal bond investment is the yield a taxable bond would have to offer to equal the same amount as the tax-exempt bond. Highest tax rate assumes the 3.8% Medicare tax and the top federal marginal tax rate for 2025 of 37%.