Markets & Economy
United States
- The U.S. economy remains on a solid path, with growth expected in the 2.5% to 3.0% range.
- With inflation pressures lingering, investors should consider companies with pricing power and proven dividend growth.
- Prepare for market volatility stemming from COVID variants and the midterm elections.
The American economy is healthy again and appears to be on a path toward solid growth in 2022, which should be encouraging news for U.S. financial markets.
Yet investors can be forgiven for feeling extremely uncertain about the year ahead, according to U.S. economist Darrell Spence.
“We're far enough along with the pandemic that the economy is not in distress,” Spence says, “but COVID and the response to it created a number of distortions — in global supply chains, labor markets, sectors and even politics.”
He expects U.S. economic growth to be solid but slowing in 2022, in the range of 2.5% to 3.0%, as the economy contends with waning stimulus and inflationary headwinds. Although full economic shutdowns may be behind us, emerging COVID variants, including Omicron, and other surprises could further dampen growth.
“Things are returning to normal, but none of us has experienced this before. It’s important to acknowledge there are still things we don’t know,” Spence adds.
Will the economy overcome inflation pressures?
Perhaps the biggest questions on investors’ minds are about inflation. How high will it go and how long will it last?
Neither investors nor Federal Reserve officials have had to contend with meaningful inflation over the past three decades. That changed last summer.
“When stimulus-induced demand met COVID-restricted supply it created distortions in the economy,” Spence says. “And that fueled rapidly rising prices wherever there were bottlenecks.”
Fed officials have maintained that high inflation levels in the U.S. are transitory, and prices should retreat once these distortions are corrected. But Spence expects inflation levels will remain elevated throughout 2022.
“I’m not convinced that these shifts are fundamental changes to the productive capacity of the economy, so I expect inflation to moderate. But it may take longer than Fed officials expect for supply and demand to come back into balance.”
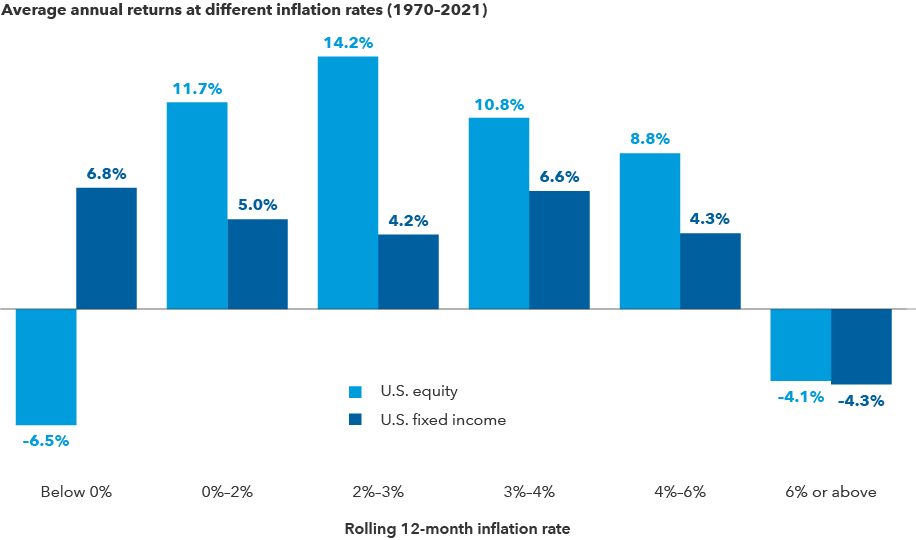
Stocks and bonds have done well in inflationary periods

Sources: Capital Group, Bloomberg Index Services Ltd., Morningstar, Standard & Poor’s. As of 10/31/21. All returns are inflation-adjusted real returns. U.S. equity returns represented by the Standard & Poor’s 500 Composite Index. U.S. fixed income represented by Ibbotson Associates SBBI U.S. Intermediate-Term Government Bond Index from 1/1/70–12/31/75, and Bloomberg U.S. Aggregate Bond Index from 1/1/76–10/31/21. Inflation rates are defined by the rolling 12-month returns of the Ibbotson Associates SBBI U.S. Inflation Index.
Investors worried about the destructive impact of inflation on their portfolios should consider this: Even during times of higher inflation, stocks and bonds have generally provided solid returns. It’s mostly at the extremes — when inflation is above 6% or negative — that financial assets have tended to struggle.
What’s more, some inflation can be healthy for companies, such as banks and commodity-linked companies that have struggled in a low inflation, low interest rate world.

Capital Ideas™ webinars
Insights for long-term success
CE credit available
Pricing power can help companies fight inflation
Inflation is so unsettling because it can erode a company’s profits and, ultimately, investor returns.
To blunt its impact, investors may want to consider investing in companies with pricing power. Pricing power can help protect a company’s profit margins by passing rising costs along to customers.
“I’m not ready to believe we are headed into a period of sustained inflation,” says equity portfolio manager Diana Wagner. “But I do believe rising costs will linger in the months ahead, making it the biggest risk investors face in 2022. That’s why I am so focused on uncovering companies with pricing power.”
Take Netflix. A string of hits like “Squid Game” and seemingly insatiable viewer demand have enabled the streaming giant to raise subscription fees four times over the past 10 years.
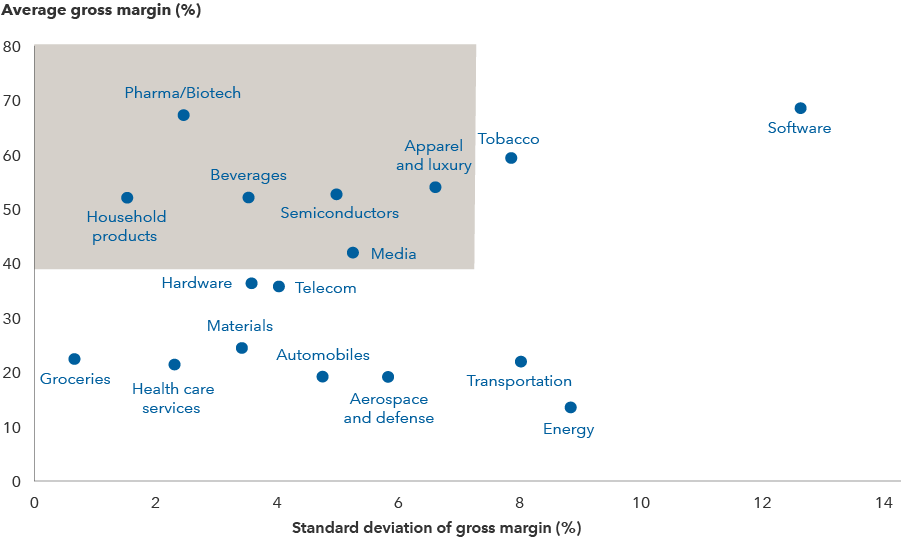
High and stable margins can be an indication of pricing power. Companies with pricing power potential include consumer businesses with strong brand recognition, like beverage makers Keurig Dr Pepper and Coca-Cola; companies in industries with favorable supply and demand dynamics, like semiconductor and chip equipment makers TSMC (Taiwan Semiconductor Manufacturing Company) and ASML; and businesses that provide essential services, like health care giants Pfizer and UnitedHealth Group.
Pricing power helps companies fight inflation

Sources: Capital Group, FactSet, MSCI. Reflects industries within the MSCI World Index. Average and standard deviation of gross margins are calculated for the five-year period ended 9/30/21. Average gross margin is net sales less the cost of goods sold and is shown as a percentage of net sales. Standard deviation is a common measure of absolute volatility that tells how returns over time have varied from the mean. A lower number signifies lower volatility.
Stocks aren’t cheap either, so selectivity is key
Consumer goods aren’t the only things that appear to be expensive. Thanks to low interest rates, accommodative central bank policy and the reopening of economies, most classes of stocks and bonds have gotten pricey.
U.S. equity markets have been generally strong in the post-pandemic period, thanks in part to robust corporate earnings. That said, price-to-earnings ratios, a measure of how expensive stocks are, have been elevated relative to historical averages.
That’s why careful security selection and diversification are more important than ever.
“We have seen a range of stocks — from fast-growing digital stocks to old economy stocks tied to the cyclical recovery — become more expensive over the past year,” says equity portfolio manager Chris Buchbinder.
“Given the level of uncertainty we face today, I am looking to strike a balance in my portfolios, seeking exposure to companies with long-term growth potential, like certain giants in e-commerce, streaming and digital payments; companies that can still participate in the cyclical recovery, like airplane engine manufacturers; and those with secular growth and cyclical components, like automaker General Motors — whose Cruise division is a leader in driverless car technology.”
Dividends are staging a comeback
One potential bright spot for investors in 2022 is the universe of dividend-paying stocks.
After record dividend cuts and suspensions during the pandemic, companies are reinstating dividend payments, and some with surplus capital are declaring catch-up dividends.
“Today I am finding no shortage of opportunities to invest in companies restoring and even increasing dividend payments,” Wagner says. “With profit margins recently near peak levels, companies are able to increase dividends despite inflationary pressures.”
Of course, not all dividend payers are created equal. Wagner is focusing not on the highest yielders, but on those companies with strong underlying earnings growth that have demonstrated a capacity and commitment to raise dividends over time. Consider, for example, semiconductor makers like Broadcom, which has increased its annual dividend in each of the last five years. Even during the pandemic, the company raised its dividend more than 11%, supported by record profitability. Such dividend growers historically have tended to generate greater returns than other dividend strategies, while also keeping up relatively well with the broader market.
Companies paying meaningful and growing dividends can be found across a range of sectors. Among these are health care services providers like UnitedHealth Group and telecommunications conglomerates like Comcast.
Midterm elections will likely move the markets
While it might feel like a lifetime away, investors may want to be mindful of the midterm elections in November. Historically, elections have little impact on the long-term direction of markets, but they tend to cause some volatility during election years.
“I don’t think this year will be any different,” Buchbinder says. “I don’t expect the result to be a huge driver of investment outcomes one way or the other. There may be a few bumps in the road, and investors should brace for short-term volatility throughout the year.”
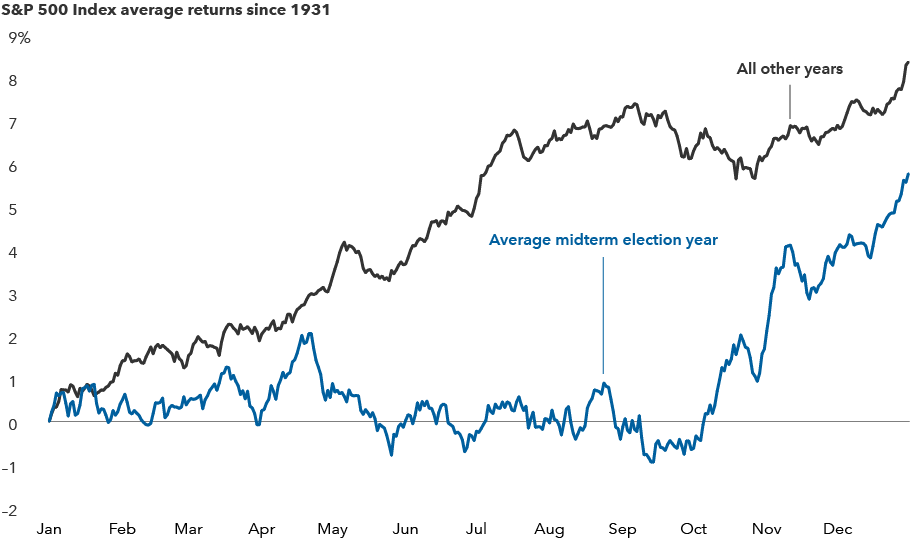
Indeed, an analysis of more than 90 years of equity returns reveals that stocks tend to have lower average returns and higher volatility for the first several months of midterm election years. As results at the polls become more predictable, this trend often reverses, and markets have tended to return to their normal upward trajectory. But these are just averages, so investors shouldn’t try to time an entry point into the market.
Prepare for stock market volatility this midterm election year

Sources: Capital Group, RIMES, Standard & Poor’s. The chart shows the average trajectory of equity returns throughout midterm election years compared to non-midterm election years. Each point on the lines represents the average year-to-date return as of that particular month and day and is calculated using daily price returns from 1/1/31–10/31/21.
Bottom line for investors: Maintain balance
With a laundry list of concerns including slower growth and rising inflation, many investors may be wondering if they should move some cash to the sidelines in 2022. Holding a lot of cash has typically been a drag on overall portfolio returns, and it may be especially impactful today since real returns from cash are negative.
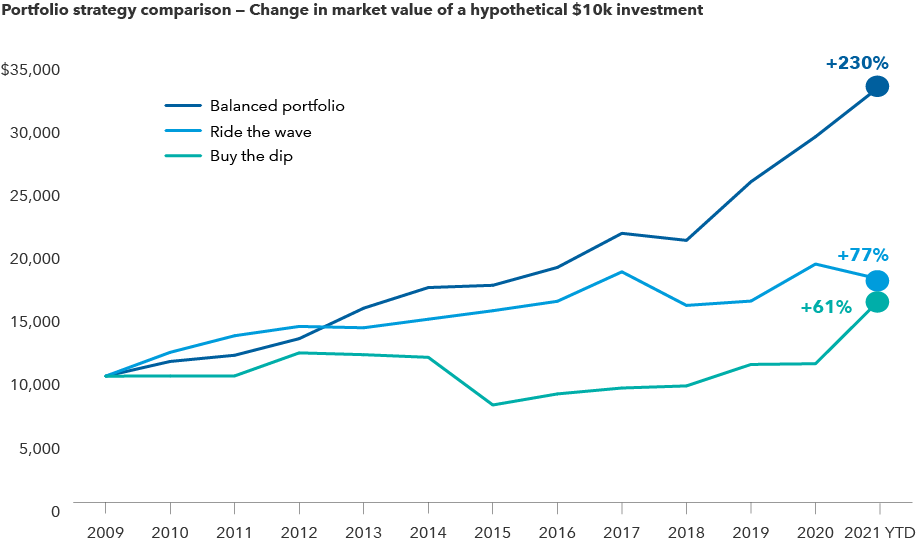
Instead, investors should consider maintaining a well-diversified, balanced portfolio like the one in the chart below.
The chart illustrates a hypothetical scenario representing three types of investors. Each year, a momentum-driven investor buys the top returning asset class from the previous year. A value-seeking investor buys the lowest returning asset class. The third investor sticks to a 60/40 balance between diversified stock and bond portfolios and rebalances at year-end. In nearly every multi-year holding period over the last 20 years, the balanced portfolio outpaced the other two, often by a wide margin.
Balanced portfolios would have outpaced other strategies over the last 20 years

Sources: Capital Group, Bloomberg Index Services Ltd., FTSE Russell, ICE Benchmark Administration Ltd., MSCI, Refinitiv Datastream, Standard & Poor's. As of October 31, 2021. "Buy the dip" strategy represents buying the prior year's worst performing asset class every year; "Ride the wave" strategy represents buying the prior year's best performing asset class every year; "Balanced portfolio" strategy represents maintaining a 60/40 split between U.S. large cap stocks and U.S. aggregate bonds. Asset classes included in the analysis: cash (Bloomberg 1–3 Month U.S. Treasury Bill Index), developed international stocks (MSCI EAFE Index), emerging markets stocks (MSCI Emerging Markets Index), foreign bonds (Bloomberg Global Aggregate Index), global commodities (S&P GSCI), gold (LBMA Gold), U.S. equity REITs (FTSE USA REIT), U.S. high-yield bonds (Bloomberg U.S. Corporate High Yield Index), U.S. aggregate bonds (Bloomberg U.S. Aggregate Index), U.S. large cap stocks (S&P 500 Index), U.S. small cap stocks (Russell 2000), U.S. taxable municipal bonds (Bloomberg Taxable Municipal Bond Index).
Within their equity portfolios, investors may want to include a mix of proven growth companies, stocks that have consistently increased dividends and companies that can maintain pricing power.
“With rising inflation and other uncertainties on the horizon, I’m optimistic that an active portfolio of select companies with strong pricing power can help investors thrive in the years ahead,” Wagner says.
Investing outside the United States involves risks, such as currency fluctuations, periods of illiquidity and price volatility, as more fully described in the prospectus. These risks may be heightened in connection with investments in developing countries. Small-company stocks entail additional risks, and they can fluctuate in price more than larger company stocks.
The return of principal for bond funds and for funds with significant underlying bond holdings is not guaranteed. Fund shares are subject to the same interest rate, inflation and credit risks associated with the underlying bond holdings. Lower rated bonds are subject to greater fluctuations in value and risk of loss of income and principal than higher rated bonds. Income from municipal bonds may be subject to state or local income taxes and/or the federal alternative minimum tax.
The market indexes are unmanaged and, therefore, have no expenses. Investors cannot invest directly in an index.
Bloomberg U.S. Aggregate Bond Index represents the U.S. investment-grade fixed-rate bond market. Bloomberg Global Aggregate Bond Index represents the global investment-grade fixed-rate bond market. Bloomberg U.S. Corporate High Yield Index covers the universe of fixed-rate, non-investment-grade debt. Bloomberg 1–3 Month U.S. Treasury Bill Index is designed to measure the performance of public obligations of the U.S. Treasury that have a remaining maturity of greater than or equal to 1 month and less than 3 months. Bloomberg Taxable Municipal Bond Index is a market value-weighted index designed to represent the long-term investment-grade taxable municipal bond market.
FTSE USA REIT Index represents the market for U.S.-based real estate investment trust (REIT) companies.
Ibbotson Associates SBBI U.S. Intermediate-Term Government Bond Index is a measure of the U.S. government bond market. Ibbotson Associates SBBI U.S. Inflation Index is a measure of the average change over time in the prices paid by urban consumers for a market basket of consumer goods and services.
LBMA Gold Price represents the global benchmark spot prices for unallocated gold delivered in London and is administered independently by ICE Benchmark Administration.
MSCI EAFE (Europe, Australasia, Far East) Index is a free float-adjusted market capitalization-weighted index designed to measure developed equity market results, excluding the United States and Canada. MSCI Emerging Markets Index captures large- and mid-cap representation across 27 emerging markets (EM) countries. MSCI World Index is a free float-adjusted market capitalization-weighted index designed to measure equity market results of developed markets. The index consists of more than 20 developed market country indexes, including the United States.
Russell 2000 Index measures the performance of 2,000 small cap stocks.
Standard & Poor's 500 Composite Index is a market capitalization-weighted index based on the results of approximately 500 widely held common stocks.
S&P GSCI is a is a broad-based production-weighted index of the global commodities market.
BLOOMBERG® is a trademark and service mark of Bloomberg Finance L.P. and its affiliates (collectively “Bloomberg”). Bloomberg or Bloomberg’s licensors own all proprietary rights in the Bloomberg Indices. Neither Bloomberg nor Bloomberg’s licensors approves or endorses this material, or guarantees the accuracy or completeness of any information herein, or makes any warranty, express or implied, as to the results to be obtained therefrom and, to the maximum extent allowed by law, neither shall have any liability or responsibility for injury or damages arising in connection therewith.
London Stock Exchange Group plc and its group undertakings (collectively, the “LSE Group”). © LSE Group 2021. FTSE Russell is a trading name of certain of the LSE Group companies. FTSE® and Russell® indexes are trademarks of the relevant LSE Group companies and are used by any other LSE Group company under license. All rights in the FTSE Russell indexes or data vest in the relevant LSE Group company which owns the index or the data. Neither LSE Group nor its licensors accept any liability for any errors or omissions in the indexes or data and no party may rely on any indexes or data contained in this communication. No further distribution of data from the LSE Group is permitted without the relevant LSE Group company’s express written consent. The LSE Group does not promote, sponsor or endorse the content of this communication.
©2021 Morningstar, Inc. All rights reserved. The information contained herein: (1) is proprietary to Morningstar and/or its content providers; (2) may not be copied or distributed; and (3) is not warranted to be accurate, complete or timely. Neither Morningstar nor its content providers are responsible for any damages or losses arising from any use of this information. Past performance is no guarantee of future results.
MSCI has not approved, reviewed or produced this report, makes no express or implied warranties or representations and is not liable whatsoever for any data in the report. You may not redistribute the MSCI data or use it as a basis for other indices or investment products.
Standard & Poor’s 500 Composite Index (“Index”) is a product of S&P Dow Jones Indices LLC and/or its affiliates and has been licensed for use by Capital Group. Copyright © 2021 S&P Dow Jones Indices LLC, a division of S&P Global, and/or its affiliates. All rights reserved. Redistribution or reproduction in whole or in part is prohibited without written permission of S&P Dow Jones Indices LLC.
RELATED INSIGHTS
-
-
Asset Allocation
-
Never miss an insight
The Capital Ideas newsletter delivers weekly insights straight to your inbox.
 Darrell Spence
 Diana Wagner
 Chris Buchbinder