TARGET DATE

Participant outcomes continue to take center stage in recent QDIA litigation

KEY TAKEAWAYS

  • A shift toward participant outcomes and away from fee-based litigation continues, especially within target date products.
  • Differences in returns continue to meaningfully surpass differences in fees, so a balanced approach to comparing both is prudent.
  • Monitoring and measuring long-term consistency can make all the difference for fiduciaries. 

Plan sponsors face ongoing scrutiny over the performance of their qualified default investment alternative (QDIA) selections, especially within target date products. In the past couple of years, several legal cases have been filed against plan sponsors and fiduciaries alleging Employee Retirement Income Security Act (ERISA) violations tied to the underperformance of their selected target date funds. While some of those cases have been dismissed, several of them have advanced to class action status.


With the panoply of target date funds (TDFs) available for plan sponsors and fiduciaries to choose from — running the spectrum from fully active to fully passive and with differing approaches to various asset class exposures and other characteristics — this increase in litigiousness raises the stakes when it comes to QDIA manager selection and monitoring. A sole focus on fees has never been enough to justify the choice of QDIA, and now participant outcomes net of fees (as well as their durability and consistency) are increasingly called into question.


Not only is choosing and keeping an underperforming QDIA solution a potential legal threat for plan sponsors, but it can also be very costly. After years of litigation, UnitedHealth Group agreed to settle its class action lawsuit in December 2024. The company agreed to pay $69 million to about 300,000 current and former participants of its 401(k) Savings Plan, according to a court filing.


In the past, judges have been appropriately skeptical of returns-focused litigation. Now that some of these cases have been elevated to class action status, it signals a significant shift that may spark even further scrutiny, especially given the wide dispersion of investment results among providers.


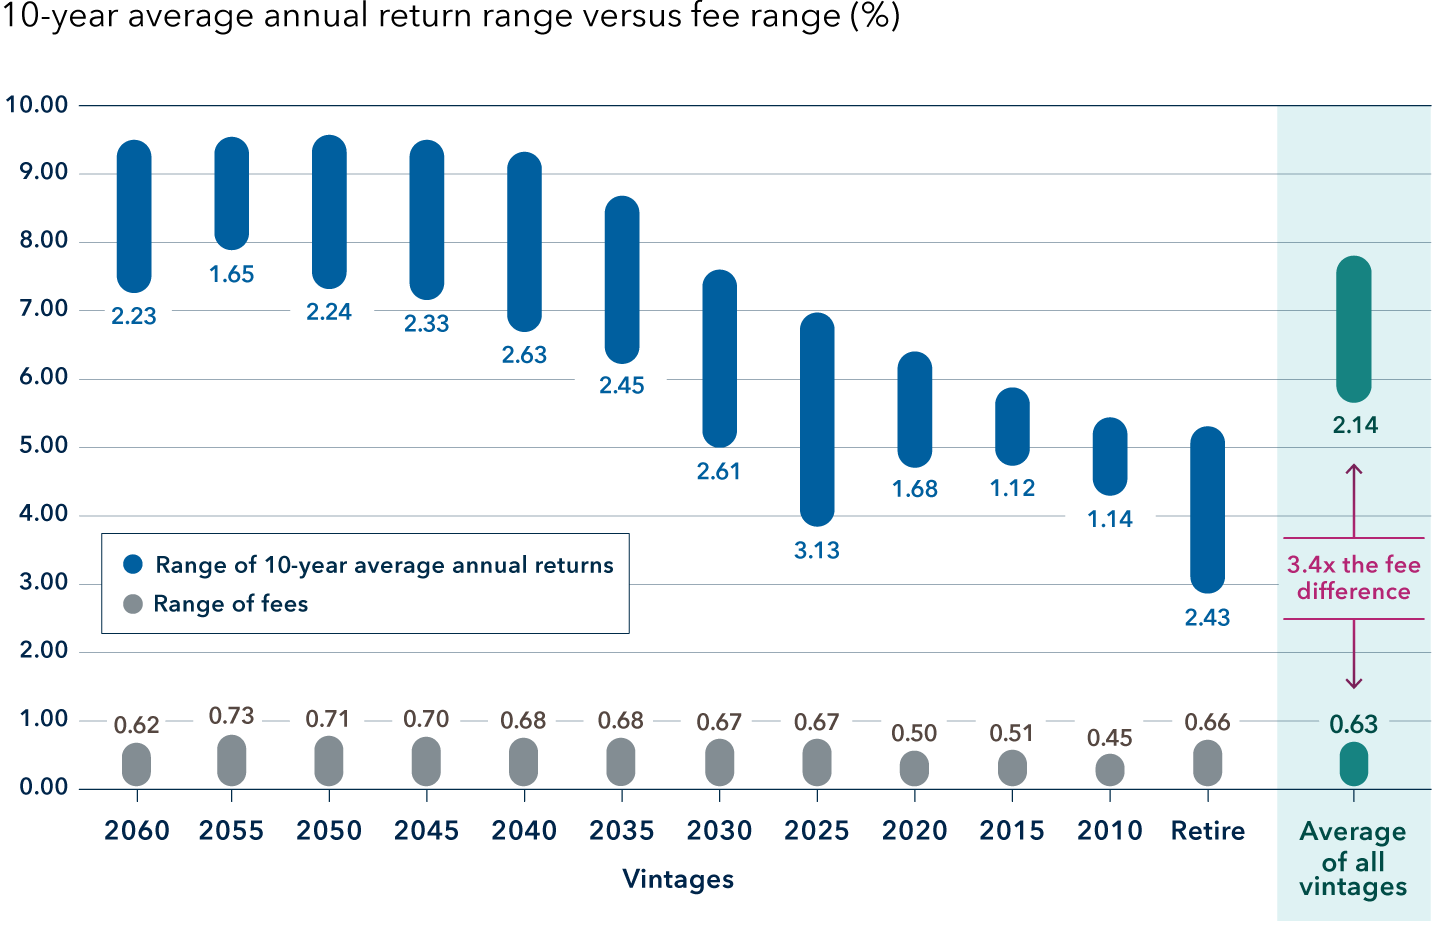
On average, the dispersion of participant outcomes has been 3.4 times greater than the dispersion of fees among target date providers.

Dispersion of target date fund returns far outpaced difference in fees

This chart compares the range of 10-year average annual returns with the range of fees for 12 target date vintages. It also provides the average for each range. The 2060 vintage has a 10-year average annual return range of 2.23% (minimum return: 7.30%; maximum return: 9.53%) and a fee range of 0.62% (minimum fee: 0.05%; maximum fee 0.67%). The 2055 vintage has a 10-year average annual return range of 1.65% (minimum return: 7.92%; maximum return: 9.57%) and a fee range of 0.73% (minimum fee: 0.05%; maximum fee 0.78%). The 2050 vintage has a 10-year average annual return range of 2.24% (minimum return: 7.36%; maximum return: 9.59%) and a fee range of 0.71% (minimum fee: 0.05%; maximum fee 0.76%). The 2045 vintage has a 10-year average annual return range of 2.33% (minimum return: 7.19%; maximum return: 9.52%) and a fee range of 0.70% (minimum fee: 0.05%; maximum fee 0.75%). The 2040 vintage has a 10-year average annual return range of 2.63% (minimum return: 6.72%; maximum return: 9.35%) and a fee range of 0.68% (minimum fee: 0.05%; maximum fee 0.73%). The 2035 vintage has a 10-year average annual return range of 2.45% (minimum return: 6.26%; maximum return: 8.71%) and a fee range of 0.68% (minimum fee: 0.05%; maximum fee 0.73%). The 2030 vintage has a 10-year average annual return range of 2.61% (minimum return: 5.02%; maximum return: 7.63%) and a fee range of 0.67% (minimum fee: 0.05%; maximum fee 0.72%). The 2025 vintage has a 10-year average annual return range of 3.13% (minimum return: 3.87%; maximum return: 6.99%) and a fee range of 0.67% (minimum fee: 0.05%; maximum fee 0.72%). The 2020 vintage has a 10-year average annual return range of 1.68% (minimum return: 4.73%; maximum return: 6.41%) and a fee range of 0.50% (minimum fee: 0.05%; maximum fee 0.55%). The 2015 vintage has a 10-year average annual return range of 1.12% (minimum return: 4.76%; maximum return: 5.88%) and a fee range of 0.51% (minimum fee: 0.05%; maximum fee 0.56%). The 2010 vintage has a 10-year average annual return range of 1.14% (minimum return: 4.32%; maximum return: 5.45%) and a fee range of 0.45% (minimum fee: 0.05%; maximum fee 0.50%). The in-retirement, or “retire,” vintage has a 10-year average annual return range of 2.43% (minimum return: 2.88%; maximum return: 5.32%) and a fee range of 0.66% (minimum fee: 0.05%; maximum fee 0.71%). The average vintage has a 10-year average annual return range of 2.14% (minimum return: 5.69%; maximum return: 7.83%) and a fee range of 0.63% (minimum fee: 0.05%; maximum fee 0.68%). Callout text with up and down arrows between the average ranges specifies that the average for the 10-year average annual return range is 3.4 times the fee range average.

Source: Capital Group, using data obtained from Morningstar as of December 31, 2024. Data shown is of the lowest-cost mutual fund share classes with a sufficient track record for each peer target date series. Represents 33 mutual fund target date series, excluding managed payout funds and target date series that are only available in wrap accounts or launched after January 1, 2015. Past results are not predictive of results in future periods.

Given this context — a fresh focus on the relative outcomes and results generated by target date funds, not just their cost — it’s reasonable for plan fiduciaries to review their approach to monitoring and evaluation, given that the variability of industry outcomes dramatically outpaces the differences in cost. A myopic focus on cost within the overall selection process seems to miss the point: The retirement futures of participants depend much more on what target date solution providers can deliver in terms of capital appreciation, portfolio income and downside resilience than on the expense ratios they charge.


In the paper below, we take a closer look at the long-term consistency in the American Funds Target Date Retirement Series® in terms of both return and risk and how it compares to its largest peers.

You must be logged in to download the PDF.

rich-lang-color-600x600

Rich Lang is a multi-asset investment director with 31 years of industry experience (as of 12/31/2024). He holds both a master’s and bachelor’s degree in finance from Loyola Marymount University. 

polina-tsybrovska-2023-color-600x600

Polina Tsybrovska is a multi-asset investment specialist with 14 years of experience (as of 12/31/2024). She holds a bachelor’s degree in finance from the University of Illinois at Chicago.

kia-haseli-color

Kia Haseli is a multi-asset product specialist with eight years of experience (as of 12/31/2024). He holds a bachelor’s degree in economics and business management from the University of California, Merced.

Investments are not FDIC-insured, nor are they deposits of or guaranteed by a bank or any other entity, so they may lose value.
Investors should carefully consider investment objectives, risks, charges and expenses. This and other important information is contained in the prospectuses and/or summary prospectuses, which can be obtained from a financial professional and should be read carefully before investing.
Although the target date portfolios are managed for investors on a projected retirement date time frame, the allocation strategy does not guarantee that investors' retirement goals will be met. Investment professionals manage the portfolio, moving it from a more growth-oriented strategy to a more income-oriented focus as the target date gets closer. The target date is the year that corresponds roughly to the year in which an investor is assumed to retire and begin taking withdrawals. Investment professionals continue to manage each portfolio for approximately 30 years after it reaches its target date.
Statements attributed to an individual represent the opinions of that individual as of the date published and do not necessarily reflect the opinions of Capital Group or its affiliates. This information is intended to highlight issues and should not be considered advice, an endorsement or a recommendation.
All Capital Group trademarks mentioned are owned by The Capital Group Companies, Inc., an affiliated company or fund. All other company and product names mentioned are the property of their respective companies.
Use of this website is intended for U.S. residents only. Use of this website and materials is also subject to approval by your home office.
Capital Client Group, Inc.
This content, developed by Capital Group, home of American Funds, should not be used as a primary basis for investment decisions and is not intended to serve as impartial investment or fiduciary advice.