Market volatility

5 charts that put market volatility in perspective

President Trump’s tariffs have put market volatility back in the spotlight.


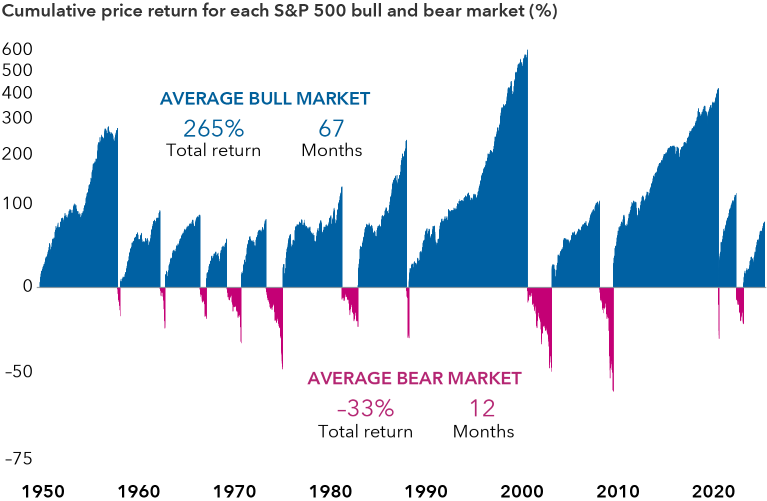
After tariffs on nearly all trading partners were announced on April 2, the S&P 500 Index briefly descended into bear market territory — a rare sign of extreme economic pessimism when stocks fall by 20% or more from their peak. A 90-day pause on reciprocal tariffs declared on April 9 caused the index to skyrocket 9.5%, only to fall 3.5% the following day.


The damage spilled over to the U.S. Treasury market, which may explain why Trump paused some tariffs. The yield on the 10-year Treasury, a cornerstone of the global financial system, widened to 4.34% from 4.01% a few days prior — an indication of market turbulence.


Given the uncertain environment, investors may have doubts about their investment approach. It’s natural to seek calmer shores when markets are choppy. But it’s equally important to step back, gain perspective and look toward the horizon.


History shows the stock market has always recovered from previous declines, though there’s no guarantee downturns will lead to rebounds. Here are five insights that can help you regain confidence and stay invested for the long haul.

1. When in doubt, zoom out

If you go back to 2018, the first Trump administration’s tariffs on China sparked a trade war that panicked markets and dominated the news, much like today. What’s more, two U.S. government shutdowns, challenging Brexit negotiations and a contentious midterm election further stoked market pessimism.


How did stocks react? Fears that a trade war between the two largest economies would lead to a global slowdown sent the S&P 500 Index down 4.4% in 2018, falling as much as 19.4% from September 20 to December 24 that year. But the index recovered sharply in 2019, up 31.1%, as trade deals were announced and consumer spending steadied.

Will market choppiness in 2025 give way to smoother sailing in 2026? There’s no way to tell, but next year’s midterm elections could shift the Trump administration’s focus to trade deals and more bread-and-butter issues that add economic optimism rather than uncertainty.

2. Markets typically have recovered quickly

While markets can be treacherous during periods of heightened volatility, they have often bounced back quickly. Indeed, stock market returns have typically been strongest after sharp declines. The average 12-month return immediately following a 15% or greater decline is 52%. That’s why it’s often best to remain calm and stay invested.

Stock market returns have been strong after steep declines

Sources: Capital Group, Standard & Poor's. Each market decline reflects a decline of at least 15% in the value of the S&P 500 Index, without dividends reinvested. Results over the various time periods are from September 7, 1929, through October 12, 2022.

How often do market corrections of 10% or more turn into entrenched bear markets? Turns out, not often. More common are short pullbacks ranging between 5% to 10%. While these may feel unsettling, on average, a drop of 5% occurred twice per year while corrections of 10% or more happened every 18 months from 1954 to 2024. And while intra-year declines are common, the good news is 37 of the last 49 calendar years have finished with positive returns.

3. Bear markets have been relatively short-lived

A long-term focus can help investors put bear markets in perspective. During the period starting January 1, 1950, and ending December 31, 2024, there were 11 periods of 20%-or-greater declines in the S&P 500. And while the average bear market decline of 33% per year might have been painful to endure, missing out on the average bull market’s 265% return could have been far worse.


Bear markets are also typically much shorter than bull markets. Bear periods have averaged 12 months, which can feel like an eternity, but pale in comparison with the 67 months of average bull markets — another reason why trying to time investment decisions is ill-advised.

A long-term focus helps provide perspective

The chart shows the cumulative price return of all U.S. bull and bear markets since 1949. It also includes the average total return and duration of the average bull and bear market during that period. There are 12 bull markets and 11 bear markets displayed on the chart. Completed bull markets had returns ranging from 48% to 582%. Completed bear markets had returns ranging from –21% to –57%. The average bull market had a 265% total return and a duration of 67 months. The average bear market had a –33% total return and a duration of 12 months.

Sources: Capital Group, RIMES, Standard & Poor's. As of December 31, 2024. The bull market that began in 2022 is considered current as of December 31, 2024, and is not included in the "average bull market" calculations. Bear markets are peak-to-trough price declines of 20% or more in the S&P 500, ending with a 50% recovery relative to the prior peak. Bull markets are all other periods. Returns shown on a logarithmic scale.

Most bear markets coincide with recessions, which are also relatively infrequent. In the absence of a recession, a growing economy can still spur positive corporate earnings growth, which supports equity prices. Market declines outside of a recession have tended to be shorter than those during a recession.


Forecasting the start of the next recession is difficult. Many investors, for example, were bracing for a recession when the Federal Reserve raised rates in 2022 to combat sky-high inflation. Instead, the U.S. economy grew, and the S&P 500 Index posted double-digit gains in 2023 and 2024.


In the current environment, steep tariffs elevate the risk of a recession. Policy uncertainty is causing companies to pause investments and hiring while prompting consumers to reduce spending. But the economy has surprised to the upside before, and it’s too early to tell if widespread job losses, the hallmark of a recession, will occur.

4. Bonds can offer balance when it is needed most

In periods of slowing economic growth, bonds often shine brightest. In fact, it’s the reason why high-quality core bond funds are often the foundation of a classic 60% equities and 40% bonds portfolio. While the exact allocation may shift, a diversified portfolio is intended to generate attractive returns while minimizing risk.


Bonds tend to zig when equity markets zag, and so far this year that pattern is holding. The Bloomberg U.S. Aggregate Index returned 1.88% year to date as of April 15, 2025, compared to the 7.89% decline of the S&P 500 Index. An exception was 2022 when stocks and bonds both fell significantly in the face of rising inflation and rapid interest rate hikes by the Fed.

Bonds may again provide diversification during equity selloffs

Sources: Capital Group, Morningstar, Bloomberg. Data as of March 31, 2025. For equity correction periods between 2010 and 2023, figures for the S&P 500 Index and Bloomberg U.S. Aggregate Index were calculated using the average cumulative returns of the indexes. Corrections are based on price declines of 10% or more (without dividends reinvested) in the S&P 500 with at least 75% recovery. Cumulative returns are based on total returns. The most recent correction shown began on February 19, 2025, and remains ongoing.

Markets are penciling in rate cuts this year in anticipation of a tariff-induced economic slowdown. Fed officials face a challenging backdrop when it comes to determining an appropriate policy response. They need to balance labor market and growth concerns with potential inflationary pressures.


Still, significant economic downturns have typically been met with rate cuts, which would have helped boost returns for core bond funds during these periods, as represented by the Bloomberg U.S. Aggregate Bond Index. Bonds should offer diversification in equity market downturns as their prices normally rise as yields fall.


Moreover, with bonds offering compelling income potential today, investors may be able to take on less risk with high-quality bonds while still meeting their return expectations.

5. Staying the course has paid off for long-term investors

When markets are volatile, it’s hard to resist the urge to do something. Suggestions to stay the course offer little comfort when markets and emotions are spiraling. But in many cases the best course of action has been none at all.


Consider two contrasting perspectives of the same 10-year period ending in 2024. The short-term view shows monthly swings in the market, the most dramatic being the 12% decline in March 2020 as COVID gripped the world and froze the global economy.


The long-term view shows a hypothetical $10,000 investment over the same time frame. Staying invested through the entire decade, riding out the ups and downs of the pandemic, would have more than tripled the investment to $34,254.

Two views of the same investment tell a very different story

Source: Standard & Poor’s. Short-term view represents the S&P 500 Index and reflects monthly return percentages from December 31, 2014 through December 31, 2024. Long-term view represented by a hypothetical $10,000 initial investment in the same index over the same time period, using one-year returns.

The lesson? Market declines can be painful to endure, but rather than trying to time the market, investors would be wise to stay the course. To weather market volatility, they should seek diversification across stocks and bonds, while periodically examining their risk tolerance for elevated volatility. Though it may feel like this time is different, markets have shown resilience throughout history when confronted by wars, pandemics and other crises.

RELATED INSIGHTS

Globalization isn’t dead. It’s changing.

Treasury market turmoil: How might the Fed react?

How to handle market declines

Past results are not predictive of results in future periods.


The market indexes are unmanaged and, therefore, have no expenses. Investors cannot invest directly in an index.


S&P 500 Index is a market capitalization-weighted index based on the results of approximately 500 widely held common stocks.


Bloomberg U.S. Aggregate Index represents the U.S. investment-grade fixed-rate bond market.


BLOOMBERG® is a trademark and service mark of Bloomberg Finance L.P. and its affiliates (collectively “Bloomberg”). Bloomberg or Bloomberg’s licensors own all proprietary rights in the Bloomberg Indices. Neither Bloomberg nor Bloomberg’s licensors approves or endorses this material, or guarantees the accuracy or completeness of any information herein, or makes any warranty, express or implied, as to the results to be obtained therefrom and, to the maximum extent allowed by law, neither shall have any liability or responsibility for injury or damages arising in connection therewith.


©2025 Morningstar, Inc. All rights reserved. The information contained herein: (1) is proprietary to Morningstar and/or its content providers; (2) may not be copied or distributed; and (3) is not warranted to be accurate, complete or timely. Neither Morningstar nor its content providers are responsible for any damages or losses arising from any use of this information. Past performance is no guarantee of future results.


The S&P 500 Index is a product of S&P Dow Jones Indices LLC and/or its affiliates and has been licensed for use by Capital Group. Copyright © 2025 S&P Dow Jones Indices LLC, a division of S&P Global, and/or its affiliates. All rights reserved. Redistribution or reproduction in whole or in part is prohibited without written permission of S&P Dow Jones Indices LLC.

Investments are not FDIC-insured, nor are they deposits of or guaranteed by a bank or any other entity, so they may lose value.
Investors should carefully consider investment objectives, risks, charges and expenses. This and other important information is contained in the mutual fund prospectuses and summary prospectuses, which can be obtained from a financial professional and should be read carefully before investing.
Statements attributed to an individual represent the opinions of that individual as of the date published and do not necessarily reflect the opinions of Capital Group or its affiliates. This information is intended to highlight issues and should not be considered advice, an endorsement or a recommendation.
All Capital Group trademarks mentioned are owned by The Capital Group Companies, Inc., an affiliated company or fund. All other company and product names mentioned are the property of their respective companies.
Use of this website is intended for U.S. residents only. Use of this website and materials is also subject to approval by your home office.
Capital Client Group, Inc.
This content, developed by Capital Group, home of American Funds, should not be used as a primary basis for investment decisions and is not intended to serve as impartial investment or fiduciary advice.