info
Some of our associates in Southern California are affected by the widespread wildfires. We are focused on ensuring that our associates who live in evacuation zones are safe and are saddened by the devastating impact to our Los Angeles communities. At this time, all of our offices are open and all investment operations are running normally. We will update this notice if needed, but we are confident that we will not experience any business impact from the wildfires.

New World Fund®: A core emerging markets allocation
KEY TAKEAWAYS
  • New World Fund’s approach has resulted in historically reduced volatility compared with peers and the MSCI Emerging Markets Index (as measured in this piece by both up and down capture ratios).
  • New World Fund can serve as a constant core in an emerging markets portfolio around which more tactical convictions can be added to the portfolio.
  • In addition to the mutual fund vehicle, investors can access a similar investment approach through CGNG – Capital Group New Geography Equity ETF.

New World Fund results based on F-2 share class


Managing an emerging markets equity sleeve of a portfolio can come with challenges, but many allocators view it as an important asset class exposure and diversifier in a portfolio. On a monthly rolling 10-year basis, emerging markets have lagged developed markets for roughly the past 15 years, but they outpaced for much of the time from 2000 to 2010, which serves as a reminder of how difficult it is to time markets.1


In the face of these challenges, New World Fund may provide ballast in an emerging markets allocation. The flexible, global approach to growth driven by emerging markets allows portfolio managers to invest in companies domiciled in emerging markets countries as well as multinational companies with revenue coming from emerging markets.


While this isn’t a “pure” approach to emerging markets, it has historically allowed investors to benefit from emerging markets growth while providing resiliency in the form of less down capture versus its Morningstar Diversified Emerging Markets Category peer average (while most funds in the category have little to no fixed income, New World Fund’s portfolio managers have the flexibility to invest a portion of the fund’s assets in fixed income — it was 3.4% of the portfolio as of 6/30/24 — and that may also help to dampen volatility relative to equity indexes). Asset allocators can consider New World Fund as a core emerging markets exposure around which they can attach tactical exposures.


For example, if an asset allocator were to become bullish on the prospects of Indian equities, they can add a country-specific fund that holds Indian equities to their emerging markets allocation alongside New World Fund. When that asset allocator later determines that they are not as bullish on Indian equities as they once were, they can scale back or remove the country-specific fund from their allocation. As specific and tactical ideas come and go, New World Fund can remain in the allocation as a constant.


Here are some specific examples of outcomes with New World Fund as a core fund in an emerging markets sleeve.


Improving down capture with New World Fund

We paired New World Fund (F-2 shares) with competitor mutual funds in a series of hypothetical 50/50 emerging markets portfolio sleeves using institutional shares (which are similar to the F-2 share class of New World Fund used in this comparison).2 We picked competitors that represented a mix of passive indexing strategies and active strategies. In every hypothetical pairing in the exhibit below, the advantage was clear: while up capture ratios would have lagged in most instances, 50/50 sleeves that included New World Fund would have had reduced volatility via improved down capture against MSCI Emerging Markets Index and would have had better Sharpe ratios on both 5- and 10-year timeframes compared with an emerging markets allocation composed of only the competitor funds.


Vanguard Emerging Markets Stock Index Fund is a passive fund that benchmarks to the FTSE Emerging Markets All Cap China A Inclusion Index. Fidelity Emerging Markets Index Fund is a passive fund that benchmarks to the MSCI Emerging Markets Index. Fidelity Advisor Emerging Markets Fund is an actively managed fund that seeks capital appreciation. DFA Emerging Markets Core Equity Portfolio and DFA Emerging Markets Value Portfolio are both actively managed funds that seek long-term capital appreciation with a tilt toward “value” style investing in the latter. Invesco Developing Markets Fund is an actively managed fund that seeks capital appreciation. JPMorgan Emerging Markets Equity Fund is an actively managed fund that seeks to provide high total return. MFS Emerging Markets Equity Fund is an actively managed fund that seeks capital appreciation. All competitors mentioned here benchmark to the MSCI Emerging Markets Index other than Vanguard Emerging Markets Stock Index Fund. In comparison, New World Fund is an actively managed mutual fund that seeks long-term capital appreciation. While New World Fund benchmarks to the MSCI All Country World Index (ACWI), analysis in this piece uses the MSCI Emerging Markets Index since it is a more common benchmark for competitor funds and emerging markets allocators.


Competitor analysis in this piece uses institutional shares (except for Fidelity Emerging Markets Index Fund, which only offers one share class). Like F-2 shares, institutional shares do not carry a sales load, but there are ongoing expenses, and this is also true for Fidelity Emerging Markets Index Fund. The expense ratios of these funds vary, and they are included at the bottom of this piece. Holdings data such as country exposure also vary, particularly among active funds that do not seek to replicate benchmark exposure. It is important for investors to understand differences in costs and objectives while considering this analysis. Please refer to each fund’s prospectus and the fund details pages linked below for more information about and the latest expense ratios and returns from these competitor funds:


New World Fund would have improved 10-year down capture and Sharpe ratios when paired with competitors
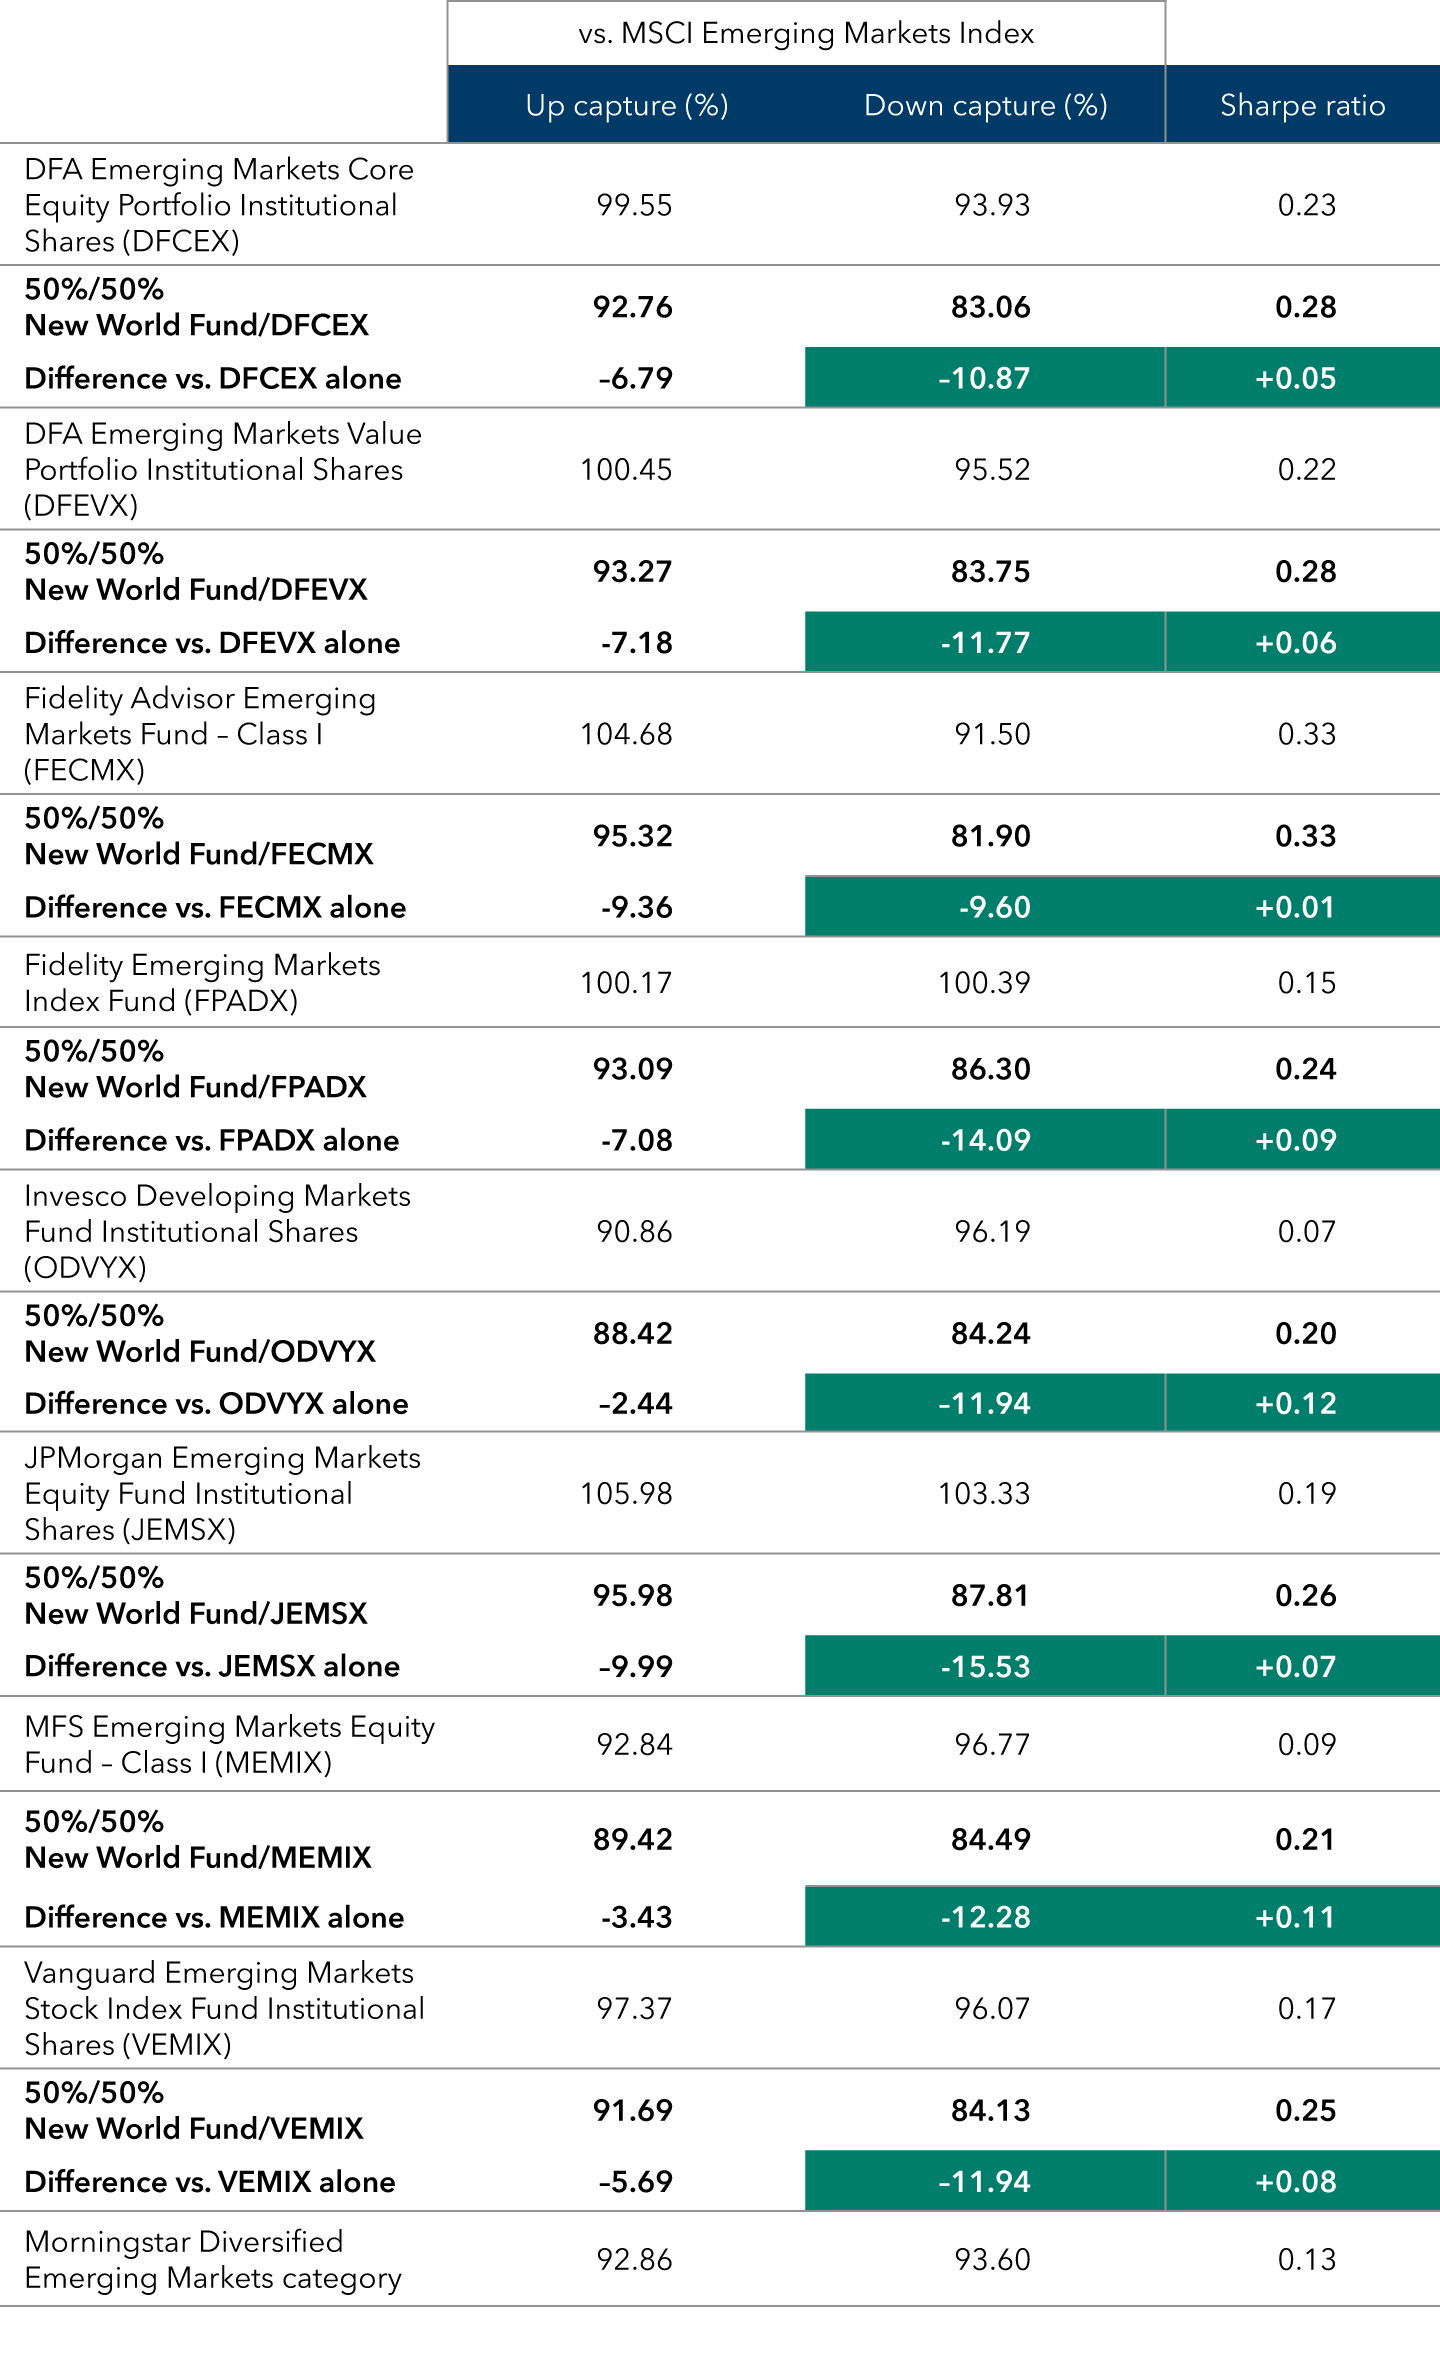
This table shows up capture, down capture and Sharpe ratio figures on 10-year timeframes for eight of New World Fund’s competitors, portfolios that pair those competitors with New World Fund and the Morningstar peer group. Capture ratios are in comparison to the MSCI Emerging Markets Index. DFA Emerging Markets Core Equity Portfolio Institutional Shares (DFCEX) had an up capture ratio of 99.55 percent, a down capture ratio of 93.93 percent and a Sharpe ratio of 0.23. By pairing the fund half-and-half with New World Fund, the up capture decreases 6.79 percentage points to become 92.76 percent, the down capture improves 10.87 percentage points to become 83.06 percent and the Sharpe ratio improves 0.05 to become 0.28. DFA Emerging Markets Value Portfolio Institutional Shares (DFEVX) had an up capture ratio of 100.45 percent, a down capture ratio of 95.52 percent and a Sharpe ratio of 0.22. By pairing the fund half-and-half with New World Fund, the up capture decreases 7.18 percentage points to become 93.27 percent, the down capture improves 11.77 percentage points to become 83.75 percent and the Sharpe ratio improves 0.06 to become 0.28. Fidelity Advisor Emerging Markets Fund – Class I (FECMX) had an up capture ratio of 104.68 percent, a down capture ratio of 91.50 percent and a Sharpe ratio of 0.33. By pairing the fund half-and-half with New World Fund, the up capture decreases 9.36 percentage points to become 95.32 percent, the down capture improves 9.60 percentage points to become 81.90 percent and the Sharpe ratio improves slightly but remains 0.33 when rounded. Fidelity Emerging Markets Index Fund (FPADX) had an up capture ratio of 100.17 percent, a down capture ratio of 100.39 percent and a Sharpe ratio of 0.15. By pairing the fund half-and-half with New World Fund, the up capture decreases 7.08 percentage points to become 93.09 percent, the down capture improves 14.09 percentage points to become 86.30 percent and the Sharpe ratio improves 0.09 to become 0.24. Invesco Developing Markets Fund Institutional Shares (ODVYX) had an up capture ratio of 90.86 percent, a down capture ratio of 96.19 percent and a Sharpe ratio of 0.07. By pairing the fund half-and-half with New World Fund, the up capture decreases 2.44 percentage points to become 88.42 percent, the down capture improves 11.94 percentage points to become 84.24 percent and the Sharpe ratio improves 0.12 to become 0.20. JPMorgan Emerging Markets Fund Institutional Shares (JEMSX) had an up capture ratio of 105.98 percent, a down capture ratio of 103.33 percent and a Sharpe ratio of 0.19. By pairing the fund half-and-half with New World Fund, the up capture decreases 9.99 percentage points to become 95.98 percent, the down capture improves 15.53 percentage points to become 87.81 percent and the Sharpe ratio improves 0.07 to become 0.26. MFS Emerging Markets Equity Fund – Class I (MEMIX) had an up capture ratio of 92.84 percent, a down capture ratio of 96.77 percent and a Sharpe ratio of 0.09. By pairing the fund half-and-half with New World Fund, the up capture decreases 3.43 percentage points to become 89.42 percent, the down capture improves 12.28 percentage points to become 84.49 percent and the Sharpe ratio improves 0.11 to become 0.21. Vanguard Emerging Markets Stock Index Fund Institutional Shares (VEMIX) had an up capture ratio of 97.37 percent, a down capture ratio of 96.07 percent and a Sharpe ratio of 0.17. By pairing the fund half-and-half with New World Fund, the up capture decreases 5.69 percentage points to become 91.69 percent, the down capture improves 11.94 percentage points to become 84.13 percent and the Sharpe ratio improves 0.08 to become 0.25. The Morningstar Diversified Emerging Markets Category average up capture ratio was 92.86 percent, the down capture ratio was 93.60 percent and the Sharpe ratio was 0.13.

Source: Morningstar. Data covers time period from 7/1/14 to 6/30/24. Totals may not reconcile due to rounding.

New World Fund would have improved 5-year down capture and Sharpe ratios when paired with competitors
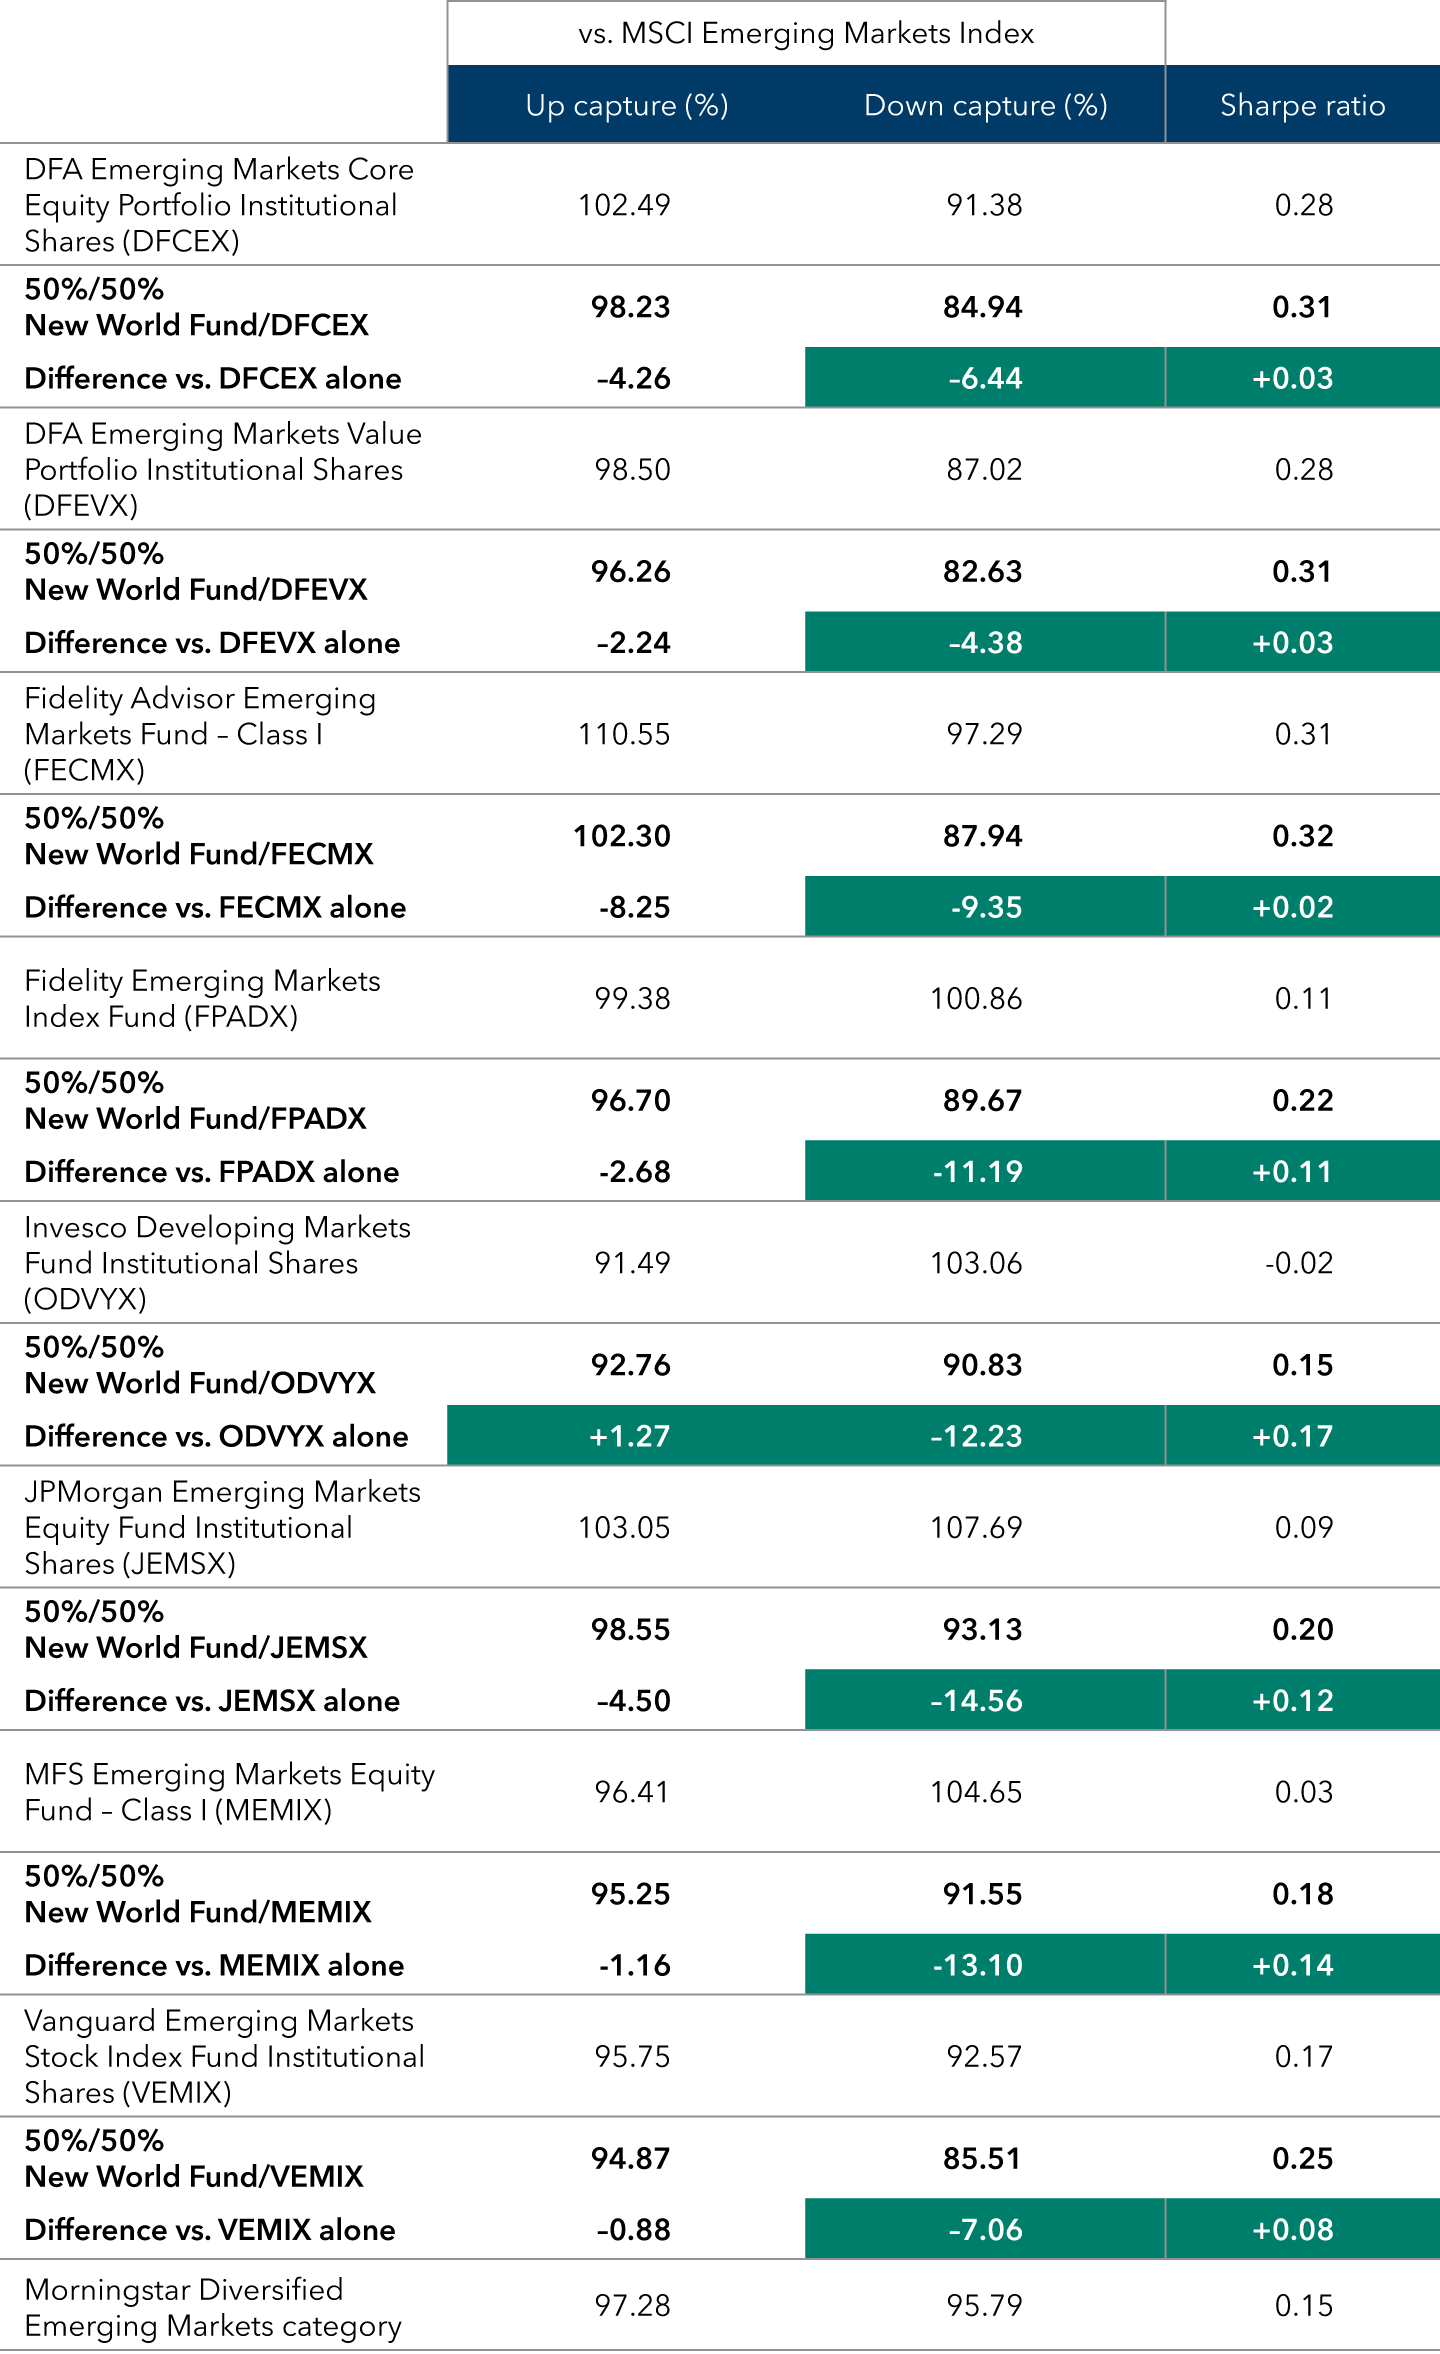
This table shows up capture, down capture and Sharpe ratio figures on 5-year timeframes for eight of New World Fund’s competitors, portfolios that pair those competitors with New World Fund and the Morningstar peer group. Capture ratios are in comparison to the MSCI Emerging Markets Index. DFA Emerging Markets Core Equity Portfolio Institutional Shares (DFCEX) had an up capture ratio of 102.49 percent, a down capture ratio of 91.38 percent and a Sharpe ratio of 0.28. By pairing the fund half-and-half with New World Fund, the up capture decreases 4.26 percentage points to become 98.23 percent, the down capture improves 6.44 percentage points to become 84.94 percent and the Sharpe ratio improves 0.03 to become 0.31. DFA Emerging Markets Value Portfolio Institutional Shares (DFEVX) had an up capture ratio of 98.50 percent, a down capture ratio of 87.02 percent and a Sharpe ratio of 0.28. By pairing the fund half-and-half with New World Fund, the up capture decreases 2.24 percentage points to become 96.26 percent, the down capture improves 4.38 percentage points to become 82.63 percent and the Sharpe ratio improves 0.03 to become 0.31. Fidelity Advisor Emerging Markets Fund – Class I (FECMX) had an up capture ratio of 110.55 percent, a down capture ratio of 97.29 percent and a Sharpe ratio of 0.31. By pairing the fund half-and-half with New World Fund, the up capture decreases 8.25 percentage points to become 102.30 percent, the down capture improves 9.35 percentage points to become 87.94 percent and the Sharpe ratio improves 0.02 to become 0.32. Fidelity Emerging Markets Index Fund (FPADX) had an up capture ratio of 99.38 percent, a down capture ratio of 100.86 percent and a Sharpe ratio of 0.11. By pairing the fund half-and-half with New World Fund, the up capture decreases 2.68 percentage points to become 96.70 percent, the down capture improves 11.19 percentage points to become 89.67 percent and the Sharpe ratio improves 0.11 to become 0.22. Invesco Developing Markets Fund Institutional Shares (ODVYX) had an up capture ratio of 91.49 percent, a down capture ratio of 103.06 percent and a Sharpe ratio of -0.02. By pairing the fund half-and-half with New World Fund, the up capture improves 1.27 percentage points to become 92.76 percent, the down capture improves 12.23 percentage points to become 90.83 percent and the Sharpe ratio improves 0.17 to become 0.15. JPMorgan Emerging Markets Fund Institutional Shares (JEMSX) had an up capture ratio of 103.05 percent, a down capture ratio of 107.69 percent and a Sharpe ratio of 0.09. By pairing the fund half-and-half with New World Fund, the up capture decreases 4.50 percentage points to become 98.55 percent, the down capture improves 14.56 percentage points to become 93.13 percent and the Sharpe ratio improves 0.12 to become 0.20. MFS Emerging Markets Equity Fund – Class I (MEMIX) had an up capture ratio of 96.41 percent, a down capture ratio of 104.65 percent and a Sharpe ratio of 0.03. By pairing the fund half-and-half with New World Fund, the up capture decreases 1.16 percentage points to become 95.25 percent, the down capture improves 13.10 percentage points to become 91.55 percent and the Sharpe ratio improves 0.14 to become 0.18. Vanguard Emerging Markets Stock Index Fund Institutional Shares (VEMIX) had an up capture ratio of 95.75, a down capture ratio of 92.57 and a Sharpe ratio of 0.17. By pairing the fund half-and-half with New World Fund, the up capture decreases 88 basis points to become 94.87 percent, the down capture improves 7.06 percentage points to become 85.51 percent and the Sharpe ratio improves 0.08 to become 0.25. The Morningstar Diversified Emerging Markets category average up capture ratio was 97.28 percent, the down capture ratio was 95.79 percent and the Sharpe ratio was 0.15.

Data covers time period from 7/1/19 to 6/30/24. Totals may not reconcile due to rounding.

Compared with the Morningstar Diversified Emerging Markets Category peer group average, New World Fund has had better down capture ratios over the past 5 and 10 years (F-2 shares, as of 6/30/24). That resilient approach may trail in a risk-on environment, but still produced better risk-adjusted results through a full cycle, as measured by the fund’s Sharpe ratios compared with MSCI Emerging Markets Index and Morningstar category peer average on 5- and 10-year time frames.


For investors willing to forgo some up capture, historical resiliency may help to strengthen the backbone of an emerging markets sleeve. New World Fund can serve as the core in the emerging markets sleeve, around which additional strategies can be added to the portfolio. In a risk-on environment, for example, allocators may wish to include an emerging markets strategy that focuses on a specific country, sector or theme. Conversely, when allocators are cautious about emerging markets, they can scale back their “pure” tactical exposure in favor of New World Fund’s historically less volatile approach to emerging markets.


New World Fund had less volatility over the past 5 and 10 years than its peer group average

These four bar charts show how New World Fund’s up and down capture ratios versus the MSCI Emerging Markets Index compare to the Morningstar Diversified Emerging Markets Category average. New World Fund’s 10-year up capture was 85.8 percent, which is 7.1 percentage points lower than the peer average of 92.9 percent. New World Fund’s 10-year down capture was 72.5 percent, which is 21.1 percentage points lower than the peer average of 93.6 percent. New World Fund’s 5-year up capture was 93.8 percent, which was 3.5 percentage points less than the peer average of 97.3 percent. New World Fund’s down capture was 78.9 percent, which is 16.9 percentage points better than the peer average of 95.8 percent.

Source: Morningstar. Chart compares capture ratios of New World Fund and the Morningstar Diversified Emerging Markets Category average against the MSCI Emerging Markets Index. The 10-year data covers the time period from 7/1/14 to 6/30/24, and the 5-year data covers the time period from 7/1/19 to 6/30/24. Totals may not reconcile due to rounding.

New World Fund’s emerging markets holdings outpaced the index

At first glance, it may seem that the results of New World Fund were largely impacted by its exposure to multinationals domiciled outside of emerging markets. However, we can strip out the impact of those developed markets companies to find that New World Fund’s emerging markets holdings outpaced the MSCI Emerging Markets Index.


In the past 10 years ended June 30, 2024, New World Fund’s emerging markets investments returned 54.24% cumulatively, with dividends reinvested gross of fees. That’s more than 20 percentage points better than the MSCI Emerging Markets Index, which returned 31.70% in the same period.


New World Fund’s emerging markets holdings outpaced the MSCI Emerging Markets Index

This bar chart compares the 10-year cumulative returns of New World Fund, the MSCI Emerging Markets Index and the emerging markets holdings within New World Fund. The MSCI Emerging Markets Index returned 31.70 percent from July 1, 2014, through June 30, 2024. New World Fund’s emerging markets holdings returned 54.24 percent in this same period, or 22.55 percentage points better than the MSCI Emerging Markets Index. New World Fund as a whole returned 71.40 percent in this same period.

Source: Capital Group. The data covers the time period from 7/1/14 to 6/30/24. The emerging markets region accounted for an average of 42.80% of New World Fund’s portfolio in the period covered. Other regions in the portfolio were the U.S. (19.73%), eurozone (10.51%), other Europe (4.37%), Japan (4.26%), Canada (1.05%), Pacific ex-Japan (4.85%) and the U.K. (4.36%). The fund also held cash at an average of 8.06% of the portfolio. Totals may not reconcile due to rounding. “New World Fund’s emerging markets holdings” does not include expenses, and if fees had been deducted, results would be lower. Investors cannot invest directly in the New World Fund emerging markets holdings.

Why New World Fund now

Allocators should consider an allocation to some emerging markets exposure in their portfolios for the benefits that have historically come with maintaining diversified portfolios, and because the space has the potential to surprise investors. Market movements in both China and India this year exemplify this element of surprise.


Here in the U.S., the potential for a slowing economy and falling rates could put downward pressure on the U.S. dollar. Historically, a falling dollar has benefited international stocks, reducing costs for companies overseas that depend on U.S. goods or have dollar-denominated loans. This could create opportunities for investors, especially when combined with the lower debt levels, falling inflation and strong balance sheets in companies across the emerging markets space.


Capital Group created New World Fund to help investors seize opportunities with exposure to the emerging markets space while seeking to reduce the volatility that can come from negative shocks on the downside.


For roughly 15 years, emerging markets have trailed developed markets in rolling monthly 10-year annualized returns.1 Markets tend to mean-revert at some point, but there’s no guarantee about when such a reversion could occur. Investors should consider maintaining constant exposure to the space to ensure they’re not left behind if emerging markets begin to outpace.


Vehicle options make emerging markets investing easier than ever

On June 27, Capital Group rolled out its latest wave of active exchange-traded funds (ETFs). Among them was CGNG – Capital Group New Geography Equity ETF. CGNG takes a similar approach to emerging markets investing as New World Fund, but CGNG does not hold fixed income, while New World Fund held 3.4% bonds as of 6/30/24. ETFs are also different investment vehicles than mutual funds. See below for a more comprehensive overview of how these two vehicles differ in taxation, trading and more.3 For those who prefer the tax efficiency and tradability offered by an ETF, they can now implement CGNG’s multi-pronged approach to emerging markets investing through this vehicle.


As a mutual fund, New World Fund has offered a strong emerging markets core with a history of resiliency. With either vehicle serving as the constant core in a portfolio, allocators can use more concentrated strategies to express specific convictions, whether that means adding more “pure” emerging markets exposure, adding country-specific funds or dialing back their exposure to concentrated strategies to express caution.
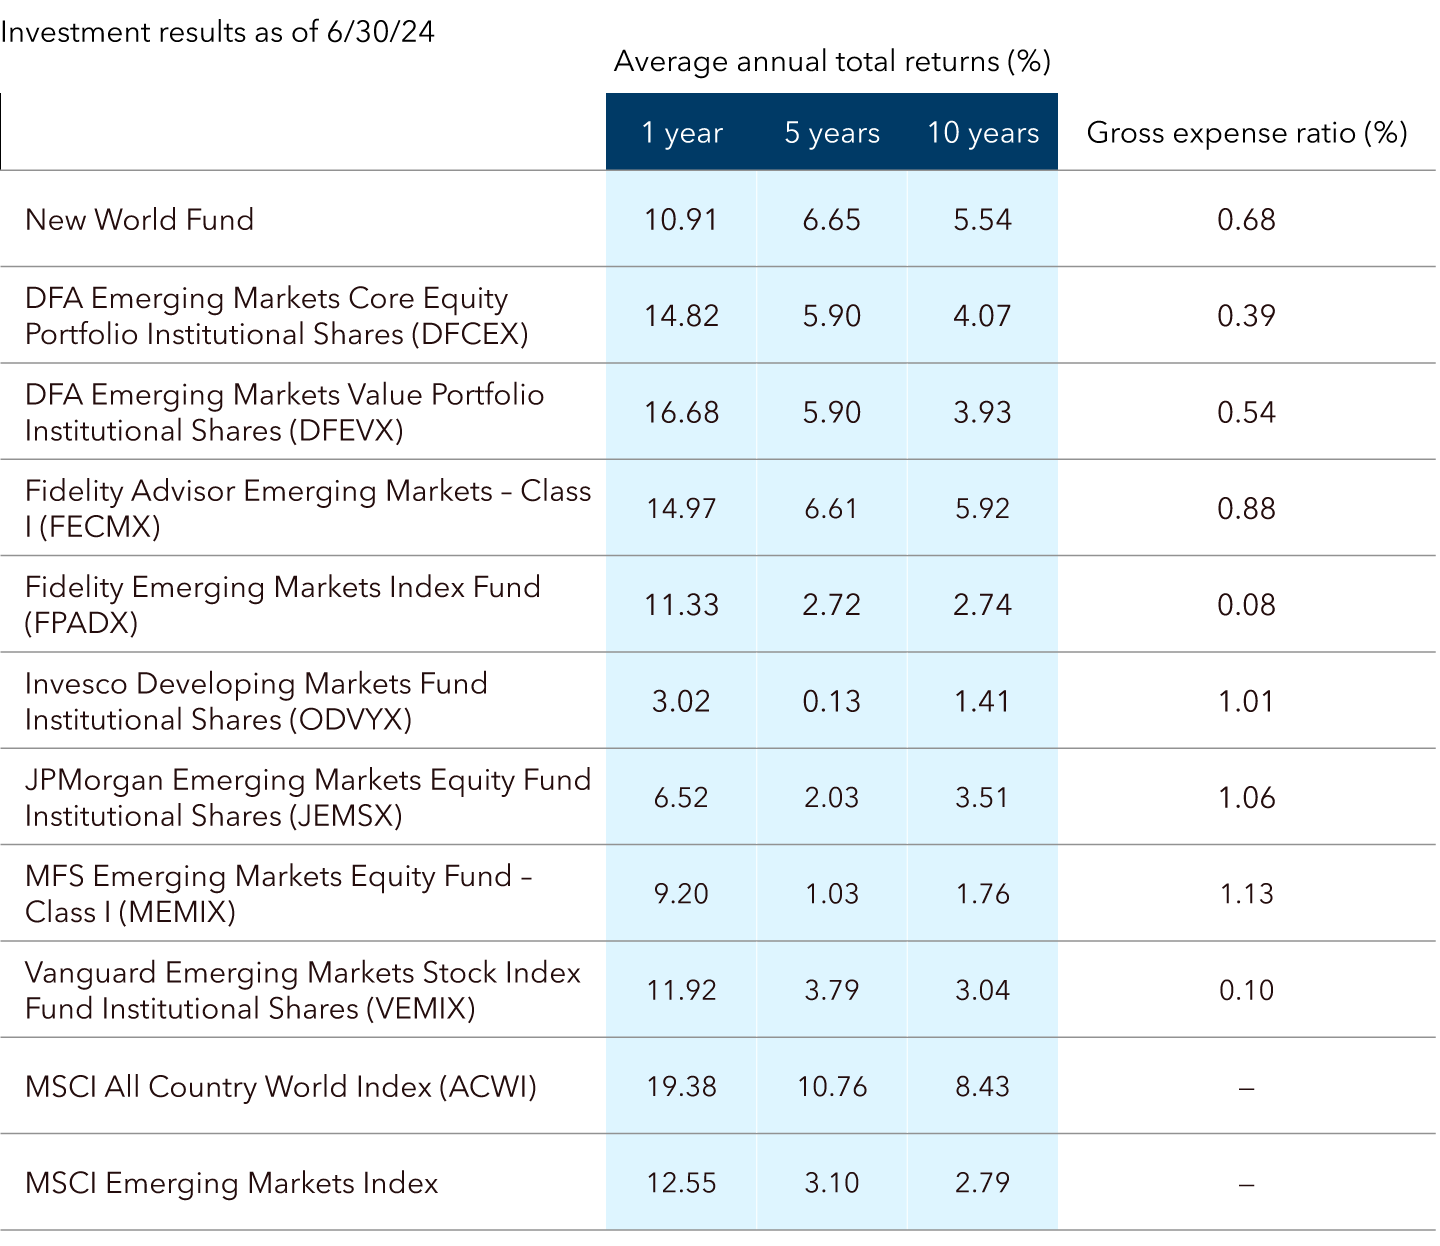

This results table covers the investment results as of June 30, 2024, for two market indexes and the funds mentioned in this piece. New World Fund returned 10.91 percent in the past year, 6.65 percent annually in the past 5 years, 5.54 percent annually in the past 10 years and it has a gross expense ratio of 0.68 percent. DFA Emerging Markets Core Equity Portfolio Institutional Shares (DFCEX) returned 14.82 percent in the past year, 5.90 percent annually in the past 5 years, 4.07 percent annually in the past 10 years and it has a gross expense ratio of 0.39 percent. DFA Emerging Markets Value Portfolio Institutional Shares (DFEVX) returned 16.68 percent in the past year, 5.90 percent annually in the past 5 years, 3.93 percent annually in the past 10 years and it has a gross expense ratio of 0.54 percent. Fidelity Advisor Emerging Markets – Class I (FECMX) returned 14.97 percent in the past year, 6.61 percent annually in the past 5 years, 5.92 percent annually in the past 10 years and it has a gross expense ratio of 0.88 percent. Fidelity Emerging Markets Index Fund (FPADX) returned 11.33 percent in the past year, 2.72 percent annually in the past 5 years, 2.74 percent annually in the past 10 years and it has a gross expense ratio of 0.08 percent. Invesco Developing Markets Fund Institutional Shares (ODVYX) returned 3.02 percent in the past year, 0.13 percent annually in the past 5 years, 1.41 percent annually in the past 10 years and it has a gross expense ratio of 1.01 percent. JPMorgan Emerging Markets Equity Fund Institutional Shares (JEMSX) returned 6.52 percent in the past year, 2.03 percent annually in the past 5 years, 3.51 percent annually in the past 10 years and it has a gross expense ratio of 1.06 percent. MFS Emerging Markets Equity Fund – Class I (MEMIX) returned 9.20 percent in the past year, 1.03 percent annually in the past 5 years, 1.76 percent annually in the past 10 years and it has a gross expense ratio of 1.13 percent. Vanguard Emerging Markets Stock Index Fund Institutional Shares (VEMIX) returned 11.92 percent in the past year, 3.79 percent annually in the past 5 years, 3.04 percent annually in the past 10 years and it has a gross expense ratio of 0.10 percent. The MSCI All Country World Index (ACWI) returned 19.38 percent in the past year, 10.76 percent annually in the past 5 years and 8.43 percent annually in the past 10 years. The MSCI Emerging Markets Index returned 12.55 percent in the past year, 3.10 percent annually in the past 5 years and 2.79 percent annually in the past 10 years.

Source: Capital Group.

1Emerging markets are represented by the MSCI Emerging Markets Index, and developed markets are represented by both the MSCI EAFE (Europe, Australasia, Far East) Index and the S&P 500 Index. Emerging markets outpaced developed markets in the 10-year period from January 1, 2000, through December 31, 2009. Developed markets outpaced emerging markets in 100% of rolling monthly 10-year periods beginning 7/1/2009 and ending 6/30/24.

2As of June 30, 2024, the competitor funds chosen were among the 13 largest funds in the Morningstar Diversified Emerging Markets category with at least 10 years of history.  Funds of funds or funds only offered as an underlying investment in a fund of funds were excluded from this analysis.

3ETF shares are bought and sold through an exchange, like a stock, and trading can happen throughout the day while the exchange is open. Mutual funds do not trade throughout the day, and any orders from the day execute after market close. Mutual fund prices are set by the net asset value (NAV) of the fund’s assets, whereas an ETF’s price is determined by market trading, and it may deviate from the NAV of the ETF’s assets. The vehicles also differ in capital gains taxation. An investor incurs capital gains tax liabilities when a mutual fund manager creates capital gains in the portfolio, even if the investor does not sell any mutual fund shares. ETF investors do not pay capital gains taxes unless they sell ETF shares, at which point they pay taxes on the capital gains for the shares sold.


Figures shown are past results and are not predictive of results in future periods. Current and future results may be lower or higher than those shown. Investing for short periods makes losses more likely. Prices and returns will vary, so investors may lose money. View mutual fund expense ratios and returns.
Investments are not FDIC-insured, nor are they deposits of or guaranteed by a bank or any other entity, so they may lose value.
Investors should carefully consider investment objectives, risks, charges and expenses. This and other important information is contained in the fund prospectuses and summary prospectuses, which can be obtained from a financial professional and should be read carefully before investing.
Lower rated bonds are subject to greater fluctuations in value and risk of loss of income and principal than higher rated bonds.
The return of principal for bond portfolios and for portfolios with significant underlying bond holdings is not guaranteed. Investments are subject to the same interest rate, inflation and credit risks associated with the underlying bond holdings.
Investing outside the United States involves risks, such as currency fluctuations, periods of illiquidity and price volatility. These risks may be heightened in connection with investments in developing countries.
There have been periods when the results lagged the index(es) and/or average(s). The indexes are unmanaged and, therefore, have no expenses. Investors cannot invest directly in an index.
MSCI has not approved, reviewed or produced this report, makes no express or implied warranties or representations and is not liable whatsoever for any data in the report. You may not redistribute the MSCI data or use it as a basis for other indices or investment products.
All Capital Group trademarks mentioned are owned by The Capital Group Companies, Inc., an affiliated company or fund. All other company and product names mentioned are the property of their respective companies.
Investment results assume all distributions are reinvested and reflect applicable fees and expenses.
Certain share classes were offered after the inception dates of some funds. Results for these shares prior to the dates of first sale are hypothetical based on the original share class results without a sales charge, adjusted for typical estimated expenses. 
  • Class F-2 shares were first offered on 8/1/2008.
Results for certain funds with an inception date after the share class inception also include hypothetical returns because those funds' shares sold after the funds' date of first offering. View dates of first sale and specific expense adjustment information.
  1. Calculated by Capital Group. Due to differing calculation methods, the figures shown here may differ from those calculated by Morningstar.
  2. Calculated by Morningstar. Due to differing calculation methods, the figures shown here may differ from those calculated by Capital Group.
Use of this website is intended for U.S. residents only.
Capital Client Group, Inc.
This content, developed by Capital Group, home of American Funds, should not be used as a primary basis for investment decisions and is not intended to serve as impartial investment or fiduciary advice.
© 2025 Morningstar, Inc. All Rights Reserved. Some of the information contained herein: (1) is proprietary to Morningstar and/or its content providers; (2) may not be copied or distributed; and (3) is not warranted to be accurate, complete or timely. Neither Morningstar, its content providers nor Capital Group are responsible for any damages or losses arising from any use of this information. Past performance is no guarantee of future results. Information is calculated by Morningstar. Due to differing calculation methods, the figures shown here may differ from those calculated by Capital Group.

Capital Group exchange-traded funds (ETFs) are actively managed and do not seek to replicate a specific index. ETF shares are bought and sold through an exchange at the then current market price, not net asset value (NAV), and are not individually redeemed from the fund. Shares may trade at a premium or discount to their NAV when traded on an exchange. Brokerage commissions will reduce returns. There can be no guarantee that an active market for ETFs will develop or be maintained, or that the ETF's listing will continue or remain unchanged.

“Peer” refers to the Morningstar Diversified Emerging Markets category.

Developed markets refer to countries with mature economies and financial markets. Compared to emerging markets, developed markets have higher levels of income. Developed markets are formally regulated by authorities to ensure they remain relatively free, fair, efficient and open to foreign investors.

Emerging markets refer to countries with growing economies that show the potential for someday becoming developed markets. Compared to developed markets, emerging markets typically have lower levels of income, a smaller impact on the global economy, less diverse exports and less stable financial markets.

Up (down) capture ratio is the ratio of a portfolio's return during periods when the index was up (down), divided by the return of the index during those periods. For example, an up-capture ratio greater than 100 indicates the portfolio produced a higher return than the index during periods when the index was up. Conversely, during periods when the index was down, a down-capture ratio greater than 100 indicates the portfolio produced a lower return than the index.

Sharpe ratio uses standard deviation and return in excess of the risk-free rate to determine reward per unit of risk. The higher the number, the better the portfolio’s historical risk-adjusted performance.

Risk-on refers to environments when the market favors relatively riskier assets, such as equity in less profitable companies or those with smaller market capitalization. Conversely, as investors shift away from riskier assets toward safer ones, the market environment becomes “risk off.”

MSCI All Country World Index is a free float-adjusted market capitalization weighted index that is designed to measure equity market results in the global developed and emerging markets, consisting of more than 40 developed and emerging market country indexes. Results reflect dividends gross of withholding taxes through December 31, 2000, and dividends net of withholding taxes thereafter. This index is unmanaged, and its results include reinvested dividends and/or distributions but do not reflect the effect of sales charges, commissions, account fees, expenses or U.S. federal income taxes.

MSCI EAFE (Europe, Australasia, Far East) Index is a free float-adjusted market capitalization weighted index that is designed to measure developed equity market results, excluding the United States and Canada. Results reflect dividends net of withholding taxes. This index is unmanaged, and its results include reinvested dividends and/or distributions but do not reflect the effect of sales charges, commissions, account fees, expenses or U.S. federal income taxes.

MSCI Emerging Markets Index is a free float-adjusted market capitalization weighted index that is designed to measure equity market results in the global emerging markets, consisting of more than 20 emerging markets country indexes. Results reflect dividends gross of withholding taxes through December 31, 2000, and dividends net of withholding taxes thereafter. This index is unmanaged, and its results include reinvested dividends and/or distributions but do not reflect the effect of sales charges, commissions, account fees, expenses or U.S. federal income taxes.

S&P 500 Index is a market capitalization-weighted index based on the results of approximately 500 widely held common stocks. This index is unmanaged, and its results include reinvested dividends and/or distributions but do not reflect the effect of sales charges, commissions, account fees, expenses or U.S. federal income taxes.

Results for non-American Funds are calculated by Morningstar. Due to differing calculation methods, the results shown here may differ from those calculated by individual fund companies.

Passive funds are not striving to outpace their benchmarks; rather, they seek to replicate the benchmark’s return pattern.

Non-American Funds may include waivers and/or reimbursements, without which results would have been lower and expenses higher. Please refer to each fund’s prospectus for details.