Portfolio Construction

Key trends in advisor portfolios: May 2024

5 MIN ARTICLE

KEY TAKEAWAYS

  • Capital Group analyzed fund flows and more than 1,400 advisor portfolios in early 2024
  • Fund flows suggest a lack of conviction in growth or value in early 2024
  • Key issues for advisors: equity concentration risk and high exposure to low dividend-paying stocks

Capital Group’s proprietary review of more than 1,400 advisor portfolios points to several key trends in early 2024, including the potential for concentration risk in equities, high exposure to low dividend-paying stocks and extended duration in fixed income. In a likely signal that investors lacked conviction in growth or value, industry fund flows show significant inflows into large blend equity strategies.

Capital Group’s Portfolio Consulting and Analytics team reviews advisor portfolios in consultation with advisors, and from these consultations develops valuable, timely insights into the way advisors as a group are constructing portfolios.


“Our commitment to consulting with advisors on portfolio construction gives us real-time insight into how advisors are building portfolios, which is invaluable to us in our role as a thought partner to advisors,” said Jan Gundersen, Senior Investment Director on Portfolio Solutions and Services at Capital Group. “We believe our insights into these trends can help advisors evaluate their own approach to portfolio construction and any unintended risk exposures that may be present.”


In summary, as U.S. equity markets continued the 2023 rally into 2024, Capital Group identified these key trends in fund flows and advisor portfolios:

1. Industry flows favor large blend equities strategies


Based on trends in fund flows, asset allocators appear to favor blend strategies, a sign they lack conviction in growth or value going forward. In the 12 months ending March 31st, large blend equity funds attracted $195 billion in net inflows, while investors moved $74 billion out of large value funds and $42 billion out of large growth funds.

The chart is labeled U.S. equity category net flows over the 12 months ending march 31st 2024.  It shows 195 billion dollars going into the large blend category, 14 billion going into small blend, 3.9 billion going into small value, 21 billion flowing out of mid-cap growth, 42 billion flowing out of large growth and 74 billion flowing out of large value.

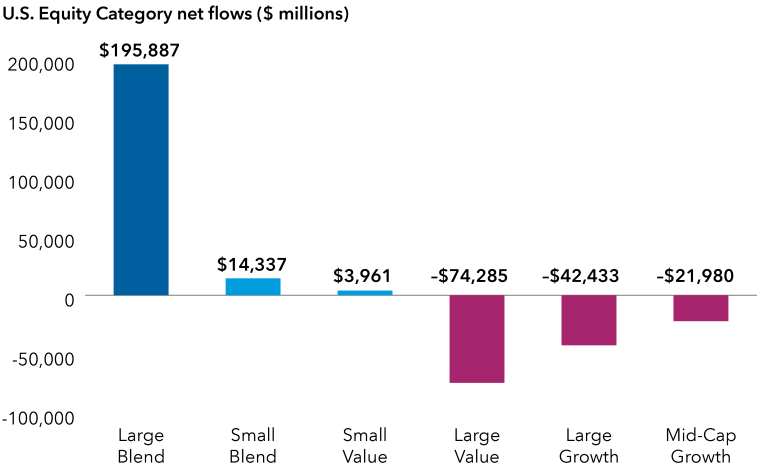
Source: Morningstar. As of 3/31/24. Data includes open-ended mutual funds and ETFs.

2. Elevated exposure to low dividend-paying stocks


Capital Group’s ability to analyze over 1,400 advisor portfolios gives us unique insight into how advisors are constructing portfolios, and where their decisions depart from ours, as expressed in Capital Group’s model portfolios. One trend that is clear is that advisors have greater exposure to low dividend payers, relative to Capital Group’s moderate growth and income model portfolio.


In building portfolios, advisors should bear in mind that dividend payers offer the potential to diversify portfolios and can mitigate risk. 

The chart is labeled “allocation to stocks by dividend yield.” It shows that in the American Funds model portfolio, 28 percent of stocks have a high dividend yield, defined as a yield of 2.7 percent or higher, while 48 percent of stocks have a medium yield, defined as 0.7 percent to 2.7 percent, and 25 percent of stocks have a low dividend yield, defined as 0.7 percent or lower. By contrast, in the average advisor portfolio, 28 percent of the stocks have high dividend yield, 39 percent a medium yield, and 34 percent a low yield.

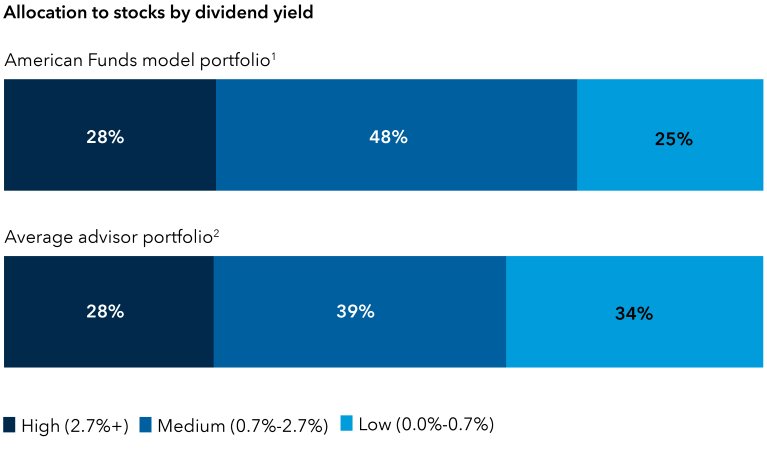
Sources: Capital Group, FactSet, Morningstar. Totals may not reconcile due to rounding.

1The American Funds Model portfolio dividend payer exposure is represented by a monthly average exposure for the American Funds Moderate Growth and Income Model Portfolio from 12/31/2023-3/31/2024. This model aligns closely with the broad asset allocation of the average advisor allocation with 63% equity and 37% fixed income.

2The average advisor portfolio is representative of the aggregate exposure of 1,402 portfolios analyzed by Capital Group’s Portfolio Consulting and Analytics team from 1/1/2024 to 3/31/2024.

 3. Advisor portfolios face potential for equity concentration risk


The “magnificent 7” stocks (Alphabet, Amazon, Apple, Meta Platforms, Microsoft, Nvidia and Tesla)  make up a significant portion of major U.S. equity indexes. For example, those seven stocks make up 29% of the S&P 500 index, but are producing only 24% of the S&P 500’s recurring earnings as of March 31, 2024. Total returns for the seven have been mixed in the recent market cycle, with four of the seven stocks returning less than the S&P 500. Accordingly, Capital Group encourages advisors to consider a more diversified approach to capital appreciation.


“One factor for advisors to consider as they assess equity concentration risks in this market cycle is exposure to passive investment vehicles,” Gundersen said. “One way to mitigate those risks is to consider active equity strategies where portfolio managers can carefully weigh and manage the pros and cons of holding large concentrated positions.”

Total returns for the “Magnificent Seven” stocks were mixed over a two-year market cycle

The chart is labeled “total returns for the magnificent seven stocks were mixed over a two-year market cycle.” It shows the growth of a hypothetical investment of ten thousand dollars into each of the magnificent seven stocks over the two years ending March 31, 2024, and shows the returns of each “magnificent 7” stock versus return on two indexes, the S&P 500 (gross return) and the Russell 1000 Growth (total return). For the S&P 500, the ten thousand dollar investment grew to 11,984 dollars. For the Russel 1000 Growth, the same investment grew to 12,384 dollars. Returns on the magnificent 7 stocks were as follows: for Tesla, the 10,000 dollar investment was worth 4,894 dollars after two years. For Apple, 9,933 dollars. For Alphabet, 10,903 dollars. For Amazon, 11,066 dollars. For Microsoft, 13,894 dollars. For Meta Platforms, 21,861 dollars. And for Nvidia, 33,155 dollars.

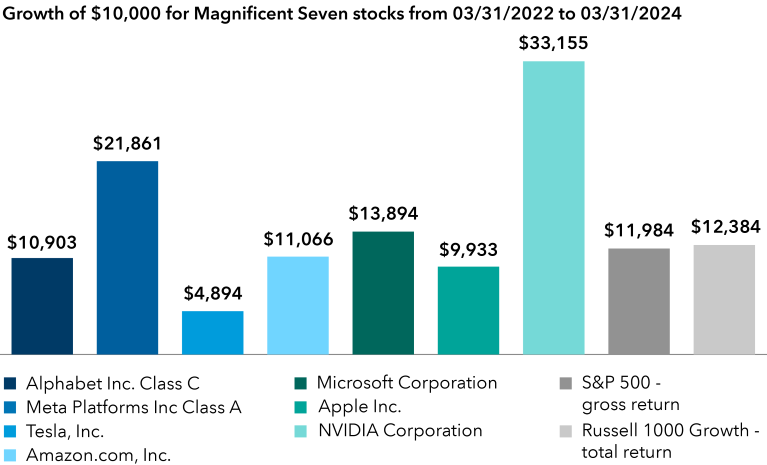
Source: FactSet. Data as of March 31, 2024. Magnificent Seven stocks are defined as Alphabet, Amazon, Apple, Meta Platforms, Microsoft, Nvidia and Tesla. Returns do not included taxes, fees or expenses. The indexes are unmanaged and have no expenses; investors cannot invest directly in an index. Past results are not predictive of results in future periods.

Extended duration in fixed income, unintentional credit exposure


We see two trends of note in advisors’ fixed income holdings. First, while advisors are extending duration in anticipation of lower interest rates, duration for the average advisor portfolio remains lower than the American Funds Moderate Growth and Income Model Portfolio. 


Additionally, our review indicates many advisor portfolios may have unintentional exposure to lower-rated bonds that carry higher credit risk via intermediate core plus allocations. We encourage investors to guard against unintentional credit exposure and to consider extending duration further with a strong core and a dedicated credit exposure relative to client goals.

Extended duration in fixed income, unintentional credit exposure.

The chart shows average fixed income duration for the average advisor portfolio versus the American Funds model portfolio. It shows advisors with an average duration of 4.50 years, and the American Funds model with a duration of 5.29 years.

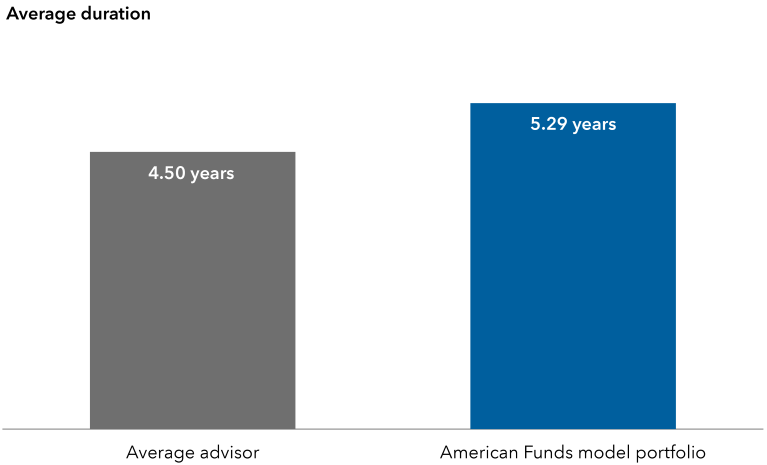
Source: Data from the Capital Group Portfolio Consulting and Analytics team based on analysis of 1,402 advisors’ portfolios from 1/1/24 to 3/31/24. American Funds model portfolio represents the most recent available data, as of 3/31/24, for the American Funds Moderate Growth and Income Model Portfolio. This model aligns closely to the broad asset allocation of the average advisor allocation with 63% equity and 37% fixed income. Spread sectors made up 44.5% of the fixed income portion of the average advisor portfolio, while non-spread sectors made up 55.5% as of March 31, 2024.

Want to learn more about your portfolio construction relative to your advisor peers?


Get an unbiased point of view on portfolios and talk through solutions with trusted partners. Connect to your Capital Group representative or sign up for an in-depth portfolio analysis and review

save_alt

Download the entire Portfolio Constructions Insight report

JNSG

Jan Gunderson is a senior investment director on portfolio solutions and services with 25 years of industry experience as-of 12/31/23. He holds a bachelor’s degree in geology from Colgate University and a masters degree in oceanography from Texas A&M University.

Model portfolios are only available through registered investment advisers. This content is intended for registered investment advisers and their clients.


Past results are not predictive of results in future periods.


Model portfolios are subject to the risks associated with the underlying funds in the model portfolio. Investors should carefully consider investment objectives, risks, fees and expenses of the funds in the model portfolio, which are contained in the fund prospectuses. Investing outside the United States involves risks, such as currency fluctuations, periods of illiquidity and price volatility. These risks may be heightened in connection with investments in developing countries. Small-company stocks entail additional risks, and they can fluctuate in price more than larger company stocks. The return of principal for bond funds and for funds with significant underlying bond holdings is not guaranteed. Fund shares are subject to the same interest rate, inflation and credit risks associated with the underlying bond holdings. Lower rated bonds are subject to greater fluctuations in value and risk of loss of income and principal than higher rated bonds. The use of derivatives involves a variety of risks, which may be different from, or greater than, the risks associated with investing in traditional securities, such as stocks and bonds. A nondiversified fund has the ability to invest a larger percentage of assets in securities of individual issuers than a diversified fund. As a result, a single issuer could adversely affect a nondiversified fund’s results more than if the fund invested a smaller percentage of assets in securities of that issuer. See the applicable prospectus for details.


Model portfolios are provided to financial intermediaries who may or may not recommend them to clients. The portfolios consist of an allocation of funds for investors to consider and are not intended to be investment recommendations. The portfolios are asset allocations designed for individuals with different time horizons, investment objectives and risk profiles. Allocations may change and may not achieve investment objectives. If a cash allocation is not reflected in a model, the intermediary may choose to add one. Capital Group does not have investment discretion or authority over investment allocations in client accounts. Rebalancing approaches may differ depending on where the account is held. Investors should talk to their financial professional for information on other investment alternatives that may be available. In making investment decisions, investors should consider their other assets, income and investments. Visit capitalgroup.com for current allocations.


Portfolios are managed, so holdings will change. Holdings are the weighted average of the underlying funds.  


© 2024 Morningstar, Inc. All rights reserved. The information contained herein:

(1) is proprietary to Morningstar and/or its content providers; (2) may not be copied or distributed; and (3) is not warranted to be accurate, complete, or timely. Neither Morningstar nor its content providers are responsible for any damages or losses arising from any use of this information.


The Russell 1000® Growth Index measures the performance of companies in the large- cap growth segment of the US equity markets. FTSE/Russell indexes: London Stock Exchange Group plc and its group undertakings (collectively, the “LSE Group”). © LSE Group 2024. FTSE Russell is a trading name of certain of the LSE Group companies. FTSE indexes are trademarks of the relevant LSE Group companies and are used by any other LSE Group company under license. All rights in the FTSE Russell indexes or data vest in the relevant LSE Group company which owns the index or the data. Neither LSE Group nor its licensors accept any liability for any errors or omissions in the indexes or data and no party may rely on any indexes or data contained in this communication. No further distribution of data from the LSE Group is permitted without the relevant LSE Group company‘s express written consent. The LSE Group does not promote, sponsor or endorse the content of this communication.


The S&P 500, formally known as the Standard & Poor’s 500, is a stock index that tracks the share prices of 500 of the largest public companies in the United States. Each S&P Index (“Index“) shown is a product of S&P Dow Jones Indices LLC and/or its affiliates and has been licensed for use by Capital Group. Copyright © 2024 S&P Dow Jones Indices LLC, a division of S&P Global, and/or its affiliates. All rights reserved. Redistribution or reproduction in whole or in part is prohibited without written permission of S&P Dow Jones Indices LLC.

Investments are not FDIC-insured, nor are they deposits of or guaranteed by a bank or any other entity, so they may lose value.
Investors should carefully consider investment objectives, risks, charges and expenses. This and other important information is contained in the fund prospectuses and summary prospectuses, which can be obtained from a financial professional and should be read carefully before investing.
This material does not constitute legal or tax advice. Investors should consult with their legal or tax advisors.
Statements attributed to an individual represent the opinions of that individual as of the date published and do not necessarily reflect the opinions of Capital Group or its affiliates. This information is intended to highlight issues and should not be considered advice, an endorsement or a recommendation.
All Capital Group trademarks mentioned are owned by The Capital Group Companies, Inc., an affiliated company or fund. All other company and product names mentioned are the property of their respective companies.
Use of this website is intended for U.S. residents only. Use of this website and materials is also subject to approval by your home office.
Capital Client Group, Inc.
This content, developed by Capital Group, home of American Funds, should not be used as a primary basis for investment decisions and is not intended to serve as impartial investment or fiduciary advice.