
Getting comfortable with semi-liquidity
This video outlines strategies for thinking about and communicating the risks and potential rewards of investing in semi-liquid funds like public-private solutions.
This video outlines strategies for thinking about and communicating the risks and potential rewards of investing in semi-liquid funds like public-private solutions.

Solutions portfolio manager at Capital Group
7MINVIDEO
Select each resource below to learn more.
Since private credit is not traded daily on public markets, it’s less liquid than public credit. Due to this decreased liquidity, as well as the credit spread, private credit tends to offer higher yields than comparable public assets.
The graphs below compare private credit’s annualized yield to those of core bonds and high-yield bonds. By deconstructing the components of each asset class’s yields, we can estimate the credit spread and illiquidity premium.
Hover over each bar below to view precise estimates for the components of each yield figure.
Liquidity is a key consideration when designing a client’s portfolio. How quickly will the client need access to cash, and how much? For illiquid and semi-liquid investments, such as interval funds, knowing the answers to these questions may help avoid cash shortfalls or a bad experience when seeking to liquidate investments.
Semi-liquid allocation vs. spending
We believe that maintaining a public portfolio balance that offers income of at least three times the investor’s projected annual spending requirements is a prudent criterion for portfolio liquidity management. Starting from this baseline, the examples that follow show how feasible different levels of allocation to semi-liquid investments to the same extent (if at all) might be for an investor, based on their annual spending rate.
Each of the examples includes a chart of semi-liquid allocation (a semi-liquid investment is an asset that can be converted into cash more easily than illiquid investments but not as quickly as liquid investments) vs. annual spending rate, based on our simulation framework. (See the footnote for the assumptions behind these charts.)
Here’s how to interpret the charts:
These charts are only a starting point for the upper bound of allocations to semi-liquid investments, not a definitive tool for every individual investor. Every investor is unique and will have personal investment preferences and constraints to consider before investing in semi-liquid assets.

Walter is in the middle of his career, with steady income and the following investment profile:
Here is a chart describing the feasibility of various levels of semi-liquid private credit investment for Walter based on his specific portfolio allocations, according to our analysis:
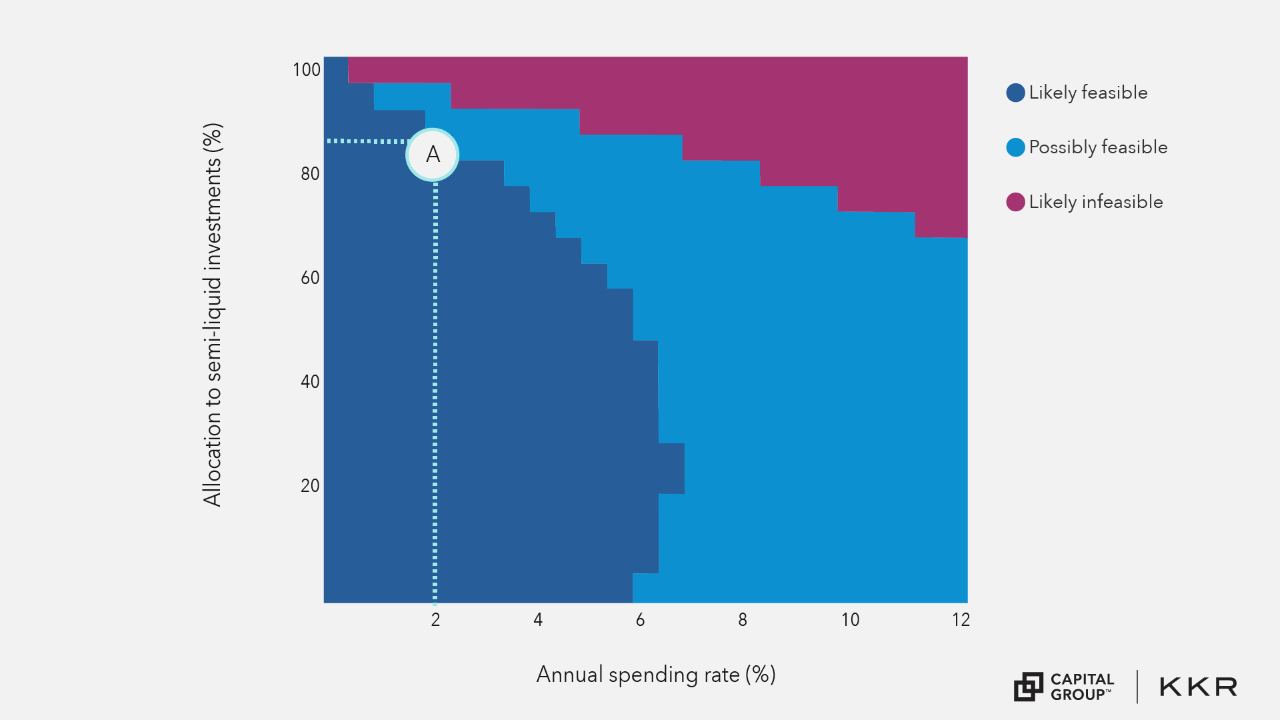
In our analysis, Walter could allocate up to 85% of his portfolio to semi-liquid private credit investments (Point A) while still reasonably expecting to accommodate his 2% spending rate. This is significantly higher than his current allotment of 5% to semi-liquid private credit. Exactly how much Walter should allocate will be up to other strategic considerations, but he may have a lot of room to grow that proportion.
If Walter’s spending expectation increased beyond 2%, this potentially feasible proportion would be lower. At 4% spending, for example, his maximum likely feasible semi-liquid private credit allotment would be around 70%. At 8%, any semi-liquid private credit investment would become less feasible.
Let’s look at another hypothetical example.

Joan is approaching retirement. More of her portfolio is in fixed income, and she’s looking to generate income from her portfolio while still maintaining some growth potential. Here’s her investment profile:
Here is a chart describing the feasibility of various levels of semi-liquid private credit investment for Joan, according to our analysis:
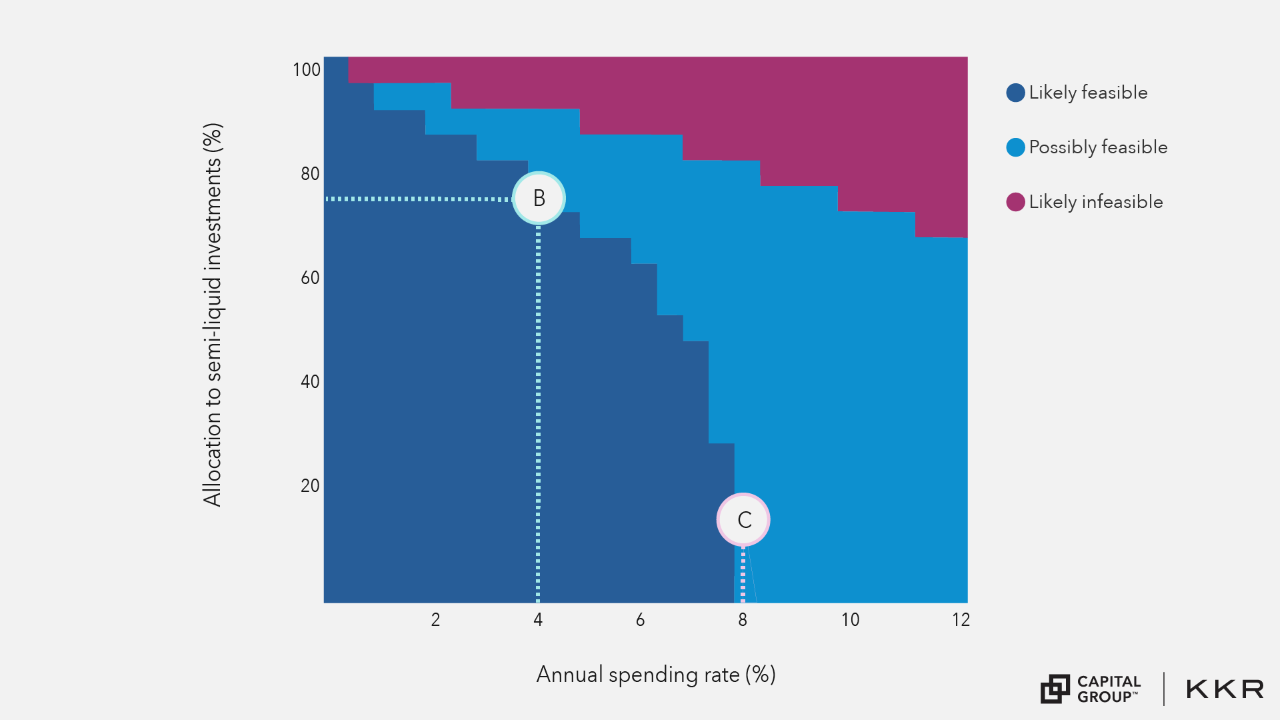
In our analysis, Joan could allocate up to 75% of her portfolio to semi-liquid private credit investments (Point B) while still reasonably expecting to accommodate her 4% spending rate. This is significantly higher than her current allotment of 15% to semi-liquid private credit. There’s potential to grow the semi-liquid, private credit allotment, if she’s interested and it would accord with her overall strategy.
If Joan’s spending expectation increased beyond 4%, her potential feasible proportion to semi-liquid assets would be lower. If her spending rose to 8%, for example, even her current allocation rate of 15% would be less feasible (Point C).
Observations
For each investor, raising their anticipated spending rate significantly reduces their feasible allotment to semi-liquid private credit. In both scenarios provided, semi-liquid allotment becomes less feasible at around a 6–8% annual spending rate. When planning around liquidity with your clients, it is critical to have a realistic estimate of their future spending rates.
Keeping all potential risks in mind, incorporating private credit into portfolios may deliver potential benefits — from enhanced yields to improved diversification. However, the success of such a strategy hinges on a tailored approach that considers your client’s liquidity needs, capacity for risk and long-term objectives.
Footnote
The assumptions behind these visuals are as follows:
Using this knowledge about liquidity, you can start thinking about which of your clients might benefit from less liquid, longer-term assets. Don’t forget to review lesson takeaways here.
The next lesson looks at the roles that private credit products can play in a portfolio.
The Cliffwater Direct Lending Index was launched on September 30, 2015. Data before this date is hypothetical (back-tested) and based on the methodology established at that time. Adjustments during back-testing aimed to capture a comprehensive universe of securities and simulate the target market or strategy, especially during market anomalies. Back-tested performance provides historical insights but has limitations, including survivorship and look-ahead biases. Actual returns may differ significantly from back-tested results, and past performance does not guarantee future results. Index returns shown do not reflect actual trading activities and exclude sales charges or fees associated with purchasing securities or investment funds tracking the Index. Additional fees and charges may impact performance of securities or funds compared to the Index. Market risks, including financial market fluctuations, liquidity risks, and regulatory risks, may affect the Index's performance. The Index may also be subject to concentration risks if heavily weighted towards specific sectors, industries, or geographic regions.
Consider the following risks for the Capital Group KKR fund(s) discussed in this material: The fund is an interval fund that provides liquidity to shareholders through quarterly repurchase offers for up to 10% of its outstanding shares under normal circumstances. To the extent more than 10% of outstanding shares are tendered for repurchase, the redemption proceeds are generally distributed proportionately to redeeming investors (“proration”). Due to this repurchase limit, shareholders may be unable to liquidate all or a portion of their investment during a particular repurchase offer window. In addition, anticipating proration, some shareholders may request more shares to be repurchased than they actually wish, increasing the likelihood of proration. Shares are not listed on any stock exchange, and we do not expect a secondary market in the shares to develop. Due to these restrictions, investors should consider their investment in the fund to be subject to illiquidity risk.
Investment strategies are not guaranteed to meet their objectives and are subject to loss. Investing in the fund is not suitable for all investors. Investors should consult their investment professional before making an investment decision and evaluate their ability to invest for the long term. Because of the nature of the fund's investments, the results of the fund's operations may be volatile. Accordingly, investors should understand that past performance is not indicative of future results.
Bond investments may be worth more or less than the original cost when redeemed. High‐yield, lower‐rated, securities involve greater risk than higher‐rated securities; portfolios that invest in them may be subject to greater levels of credit and liquidity risk than portfolios that do not. The fund may invest in structured products, which generally entail risks associated with derivative instruments and bear risks of the underlying investments, index or reference obligation. These securities include asset-based finance securities, mortgage-related assets and other asset-backed instruments, which may be sensitive to changes in interest rates, subject to early repayment risk, and their value may fluctuate in response to the market's perception of issuer creditworthiness; while generally supported by some form of government or private guarantee, there is no assurance that private guarantors will meet their obligations. While not directly correlated to changes in interest rates, the values of inflation-linked bonds generally fluctuate in response to changes in real interest rates and may experience greater losses than other debt securities with similar durations. The use of derivatives involves a variety of risks, which may be different from, or greater than, the risks associated with investing in traditional securities, such as stocks and bonds. For example, the fund may purchase and write call and put options on futures, giving the holder the right to assume a long (call) or short (put) position in a futures contract at a specified price. There is no assurance of a liquid market for any futures or futures options contract at any time. Investing outside the United States involves risks, such as currency fluctuations, periods of illiquidity and price volatility. These risks may be heightened in connection with investments in developing countries.
The fund invests in private, illiquid credit securities, consisting primarily of loans and asset-backed finance securities. The fund may invest in or originate senior loans, which hold the most senior position in a business's capital structure. Some senior loans lack an active trading market and are subject to resale restrictions, leading to potential illiquidity. The fund may need to sell other investments or borrow to meet obligations. The fund may also invest in mezzanine debt, which is generally unsecured and subordinated, carrying higher credit and liquidity risk than investment-grade corporate obligations. Default rates for mezzanine debt have historically been higher than for investment-grade securities. Bank loans are often less liquid than other types of debt instruments and general market and financial conditions may affect the prepayment of bank loans, as such the prepayments cannot be predicted with accuracy.
Illiquid assets are more difficult to sell and may become impossible to sell in volatile market conditions. Reduced liquidity may have an adverse impact on the market price of such holdings, and the fund may be unable to sell such holdings when necessary to meet its liquidity needs or to try to limit losses, or may be forced to sell at a loss. Illiquid assets are also generally difficult to value because they rarely have readily available market conditions. Such securities require fair value pricing, which is based on subjective judgments and may differ materially from the value that would be realized if the security were to be sold.
The fund is a non-diversified fund that has the ability to invest a larger percentage of assets in the securities of a smaller number of issuers than a diversified fund. As a result, poor results by a single issuer could adversely affect fund results more than if the fund were invested in a larger number of issuers. The fund intends to declare daily dividends from net investment income and distribute the accrued dividends, which may fluctuate, to investors each month. Generally, dividends begin accruing on the day payment for shares is received by the fund. In the event the fund's distribution of net investment income exceeds its income and capital gains paid by the fund's underlying investments for tax purposes, a portion of such distribution may be classified as return of capital. The fund's current intention not to use borrowings other than for temporary and/or extraordinary purposes may result in a lower yield than it could otherwise achieve by using such strategies and may make it more difficult for the fund to achieve its investment objective, than if the fund used leverage on an ongoing basis. There can be no assurance that a change in market conditions or other factors will not result in a change in the fund distribution rate at a future time.
“Cliffwater,” “Cliffwater Direct Lending Index,” and “CDLI” are trademarks of Cliffwater LLC. The Cliffwater Direct Lending Indexes (the “Indexes”) and all information on the performance or characteristics thereof (“Index Data”) are owned exclusively by Cliffwater LLC, and are referenced herein under license. Neither Cliffwater nor any of its affiliates sponsor or endorse, or are affiliated with or otherwise connected to, Capital Group Companies, Inc., or any of its products or services. All Index Data is provided for informational purposes only, on an “as available” basis, without any warranty of any kind, whether express or implied. Cliffwater and its affiliates do not accept any liability whatsoever for any errors or omissions in the Indexes or Index Data, or arising from any use of the Indexes or Index Data, and no third party may rely on any Indexes or Index Data referenced in this report. No further distribution of Index Data is permitted without the express written consent of Cliffwater. Any reference to or use of the Index or Index Data is subject to the further notices and disclaimers set forth from time to time on Cliffwater’s website at https://www.cliffwaterdirectlendingindex.com/disclosures.