
If market declines make you nervous, you’re not alone. But while bear markets can be extraordinarily difficult, they also can be moments of opportunity. Investors who find the courage and conviction to stick to their long-term plans have often been rewarded as markets bounce back.
September 30, 2024
We hope this article can help you regain confidence by providing:
- 3 facts about market recoveries
- 3 mistakes investors should avoid
- 3 actions to consider for portfolios
3 facts about market recoveries
Fact #1: Recoveries have been much longer and stronger than downturns
The good news is bear markets have been relatively short compared to recoveries. They can feel like they last forever when we’re in them, but in reality they have been much less impactful compared to the long-term power of bull markets.
Although every market decline is unique, the average bear market since 1950 has lasted 12 months. The average bull market has been more than five times longer.
The difference in returns has been just as dramatic. Even though the average bull market has averaged a 265% gain, recoveries are rarely a smooth ride. Investors often face scary headlines, significant market volatility and additional equity declines along the way. But investors able to move past the noise and stick to their plans have been better positioned when the recovery eventually occurs.
Every bull market has been longer than the bear market that preceded it
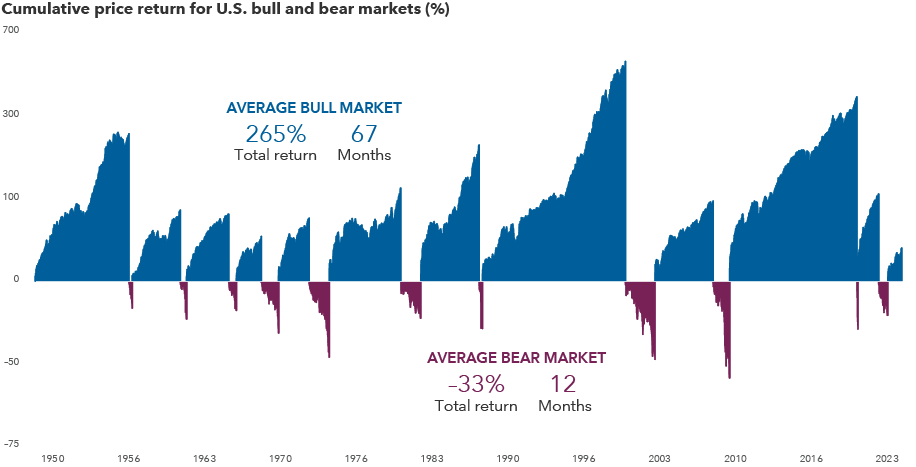
Sources: Capital Group, RIMES, Standard & Poor’s. Includes daily returns in the S&P 500 Index from 6/13/49–6/30/24. The bull market that began on 10/12/22 is considered current and is not included in the “average bull market” calculations. Bear markets are peak-to-trough price declines of 20% or more in the S&P 500. Bull markets are all other periods. Returns are in USD and are shown on a logarithmic scale. Past results are not predictive of results in future periods.
Fact #2: After large declines, markets have recovered relatively quickly
We don’t know exactly what the next recovery will look like, but historically stocks have often recovered sharply following steep downturns. We tracked the 18 biggest market declines since the Great Depression, and in each case the S&P 500 Index was higher five years later. Annual returns over those five-year periods averaged more than 18%.
Returns have often been strongest after the sharpest declines, bouncing back quickly from market bottoms. The first year following the five biggest bear markets since 1929 averaged 70.9%, underscoring the importance of staying invested and avoiding the urge to abandon stocks during market volatility. While these have been the average returns during these recoveries, each one has differed, and it's quite possible any future recovery could be more muted.
The worst bear markets were all followed by strong recoveries
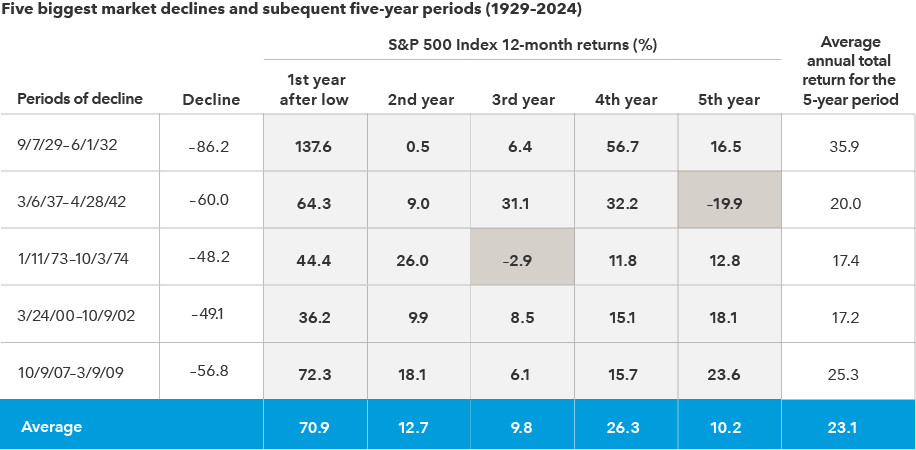
Sources: Capital Group, RIMES, Standard & Poor’s. As of 6/30/24. Market declines are based on the five largest price return declines in the S&P 500’s value (excluding dividends and/or distributions) with 100% recovery after each decline. The return for each of the five years after a low is a 12-month return based on the date of the low and is shown in total returns (includes reinvested dividends and/or distributions). Investors cannot invest directly in an index. Past results are not predictive of results in future periods.
Fact #3: Some of the world’s leading companies were born during market recoveries
Many companies got their start during tough economic periods and have gone on to become household names.
To highlight just a few: McDonald’s emerged in 1948 following a downturn caused by the U.S. government’s demobilization from a wartime economy. Walmart came along 14 years later, around the time of the “Flash Crash of 1962” — a period when the S&P 500 Index declined 27%. Airbus, Microsoft and Starbucks were founded during the stagflation era of the 1970s — a decade marked by two recessions and one of the worst bear markets in U.S. history. Not long after, Steve Jobs walked into his garage and started a small computer company called Apple.
History has shown that strong businesses find a way to survive and even thrive when times are tough. Those that can adapt to difficult conditions and become stronger have often made attractive long-term investments.
Bottom-up, fundamental research is key to separating companies that may lead a market recovery, and those more likely to be left behind.
Many businesses got their start amid volatile markets
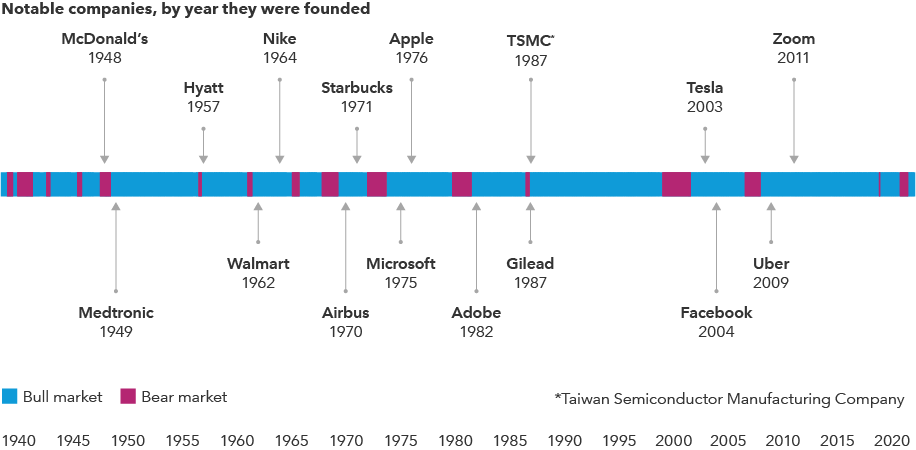
Source: Capital Group. As of 6/30/24. Bear markets are peak-to-trough price declines of 20% or more in the S&P 500. Bull markets are all other periods.
3 mistakes investors should avoid
Mistake #1: Trying to time markets
It’s time, not timing, that matters in investing. Taking your money out of the market on the way down means that if you don’t get back in at exactly the right time, you can’t capture the full benefit of any recovery.
Consider this example of a hypothetical $10,000 investment in the S&P 500 Index made on July 1, 2014, and held for 10 years. Staying invested through the two bear markets during that period may have been tough, but this patient investor’s portfolio would have nearly tripled. If that investor had instead tried to time the market and missed even some of the best days, it would have significantly hurt their long-term results — and the more missed “good” days, the more missed opportunities.
Investors who are more hesitant to put all their excess capital to work at once may want to consider dollar cost averaging in volatile markets. Dollar cost averaging during a decline allows you to purchase more shares at a lower average cost, and when markets eventually rise, those extra shares can enhance your portfolio's value.
Missing just a few of the market’s best days can hurt investment returns
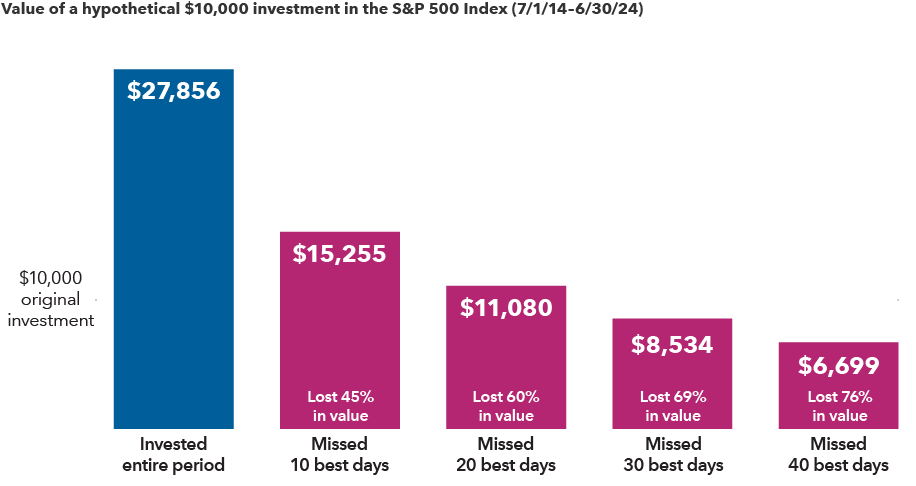
Sources: RIMES, Standard & Poor’s. As of 6/30/24. Values in USD and excludes the impact of dividends. Past results are not predictive of results in future periods. Regular investing, or dollar cost averaging, does not ensure a profit or protect against loss. Investors should consider their willingness to keep investing when share prices are declining.
Mistake #2: Assuming today’s negative headlines make it a bad time to invest
Today’s economic and geopolitical challenges may seem unprecedented, but a look through history shows that there have always been reasons not to invest. Despite negative headlines, the market’s long-term trend has always been positive. In fact, great investment opportunities often emerge when investors are feeling most pessimistic.
Consider a hypothetical investment in the S&P 500 on the day Pearl Harbor was bombed on December 7, 1941. Someone who stayed invested for the next 10 years would have averaged a 16% annual return. Likewise, a hypothetical $10,000 investment in the S&P 500 on the day Lehman Brothers declared bankruptcy on September 15, 2008, would have grown to over $30,000 10 years later. History has provided numerous examples of this.
Hear more about this topic
Mistake #3: Focusing too much on the short term
Market volatility is especially uncomfortable when you focus on short-term ups and downs. Instead, extend your time horizon to focus on the long-term growth of your investments and the progress you’ve made toward your goals.
Consider the chart below that shows contrasting perspectives of the same hypothetical investment. The short-term view is one that many investors have of their portfolios — tracing returns over short periods of time. The long-term view plots the same exact investment over the same period but shows annual change in the portfolio value invested instead. With this perspective, the short-term fluctuations of the first chart have smoothed out over time, and the picture of a growing portfolio becomes clearer.
Two views of the same investment tell a very different story
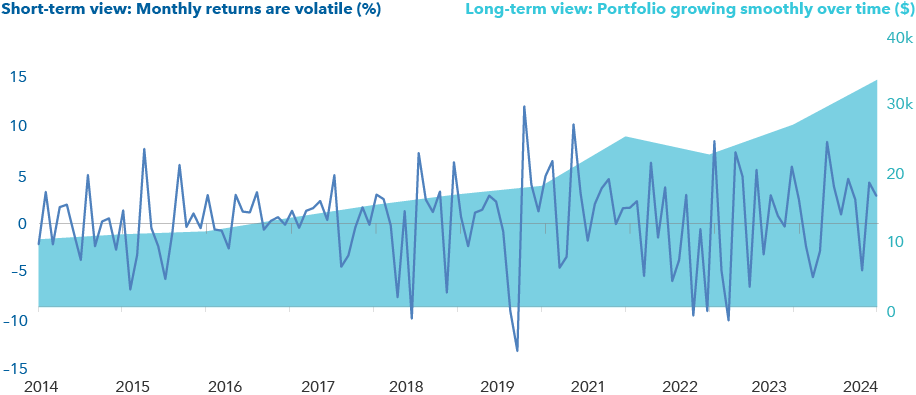
Source: Standard & Poor’s. Short-term view represents the S&P 500 Index and reflects monthly total returns from 6/30/14 through 6/30/24. Long-term view represented by a hypothetical $10,000 initial investment in the same index from 6/30/14 through 6/30/24.
3 actions to consider in portfolios
Action #1: Run a portfolio checkup
When markets are choppy, investors often shift assets from stocks and bonds into the perceived safe haven of cash and cash alternatives. With money market assets reaching a record level of $6.1 trillion (as represented by Investment Company Institute Money Market Fund Assets as of July 31, 2024), many investors’ portfolios may have become misaligned with their long-term goals. To get back on track, investors may want to examine their portfolios to ensure they are well-diversified and in line with their investment objectives.
Capital Group can help. We offer financial professionals the opportunity to conduct an in-depth analysis with our team of portfolio consultants. And if you’re an investor, now may be a good time to talk to your financial professional about having a portfolio checkup.
Action #2: Review your bond portfolio
A fixed income allocation may help to soften short-term market noise during periods of volatility and help investors remain focused on longer term goals. When evaluating your bond portfolio, consider these three steps:
- Upgrade your core: A core bond allocation can provide resilience amid equity uncertainty, while active, research-driven investing seeks to add potential upside when equities recover.
- Selectively pursue enhanced income: When stocks thrive, credit often does too. But consider a flexible, income-driven bond fund that can adjust based on shifting market conditions.
- Consider short-term bonds: Following a deep market correction, pivoting from the ultra-safe nature of cash may be daunting. Short-term bonds offer anxious investors an allocation which seeks to keep capital preservation in mind with stronger income potential than cash alternatives.
Action #3: Expand your horizons
In uncertain times, it can be natural to narrow your perspective and focus where you’re most comfortable. But when you can broaden your horizons, you may be able to benefit from the growth potential of companies in a variety of industries and markets.
And even if you think U.S. markets have bottomed and are poised for a strong recovery, don’t assume all the best stocks will come from America. Although the S&P 500 index has outpaced its international peers over the last decade, eighty percent of the top-returning stocks each year were from companies based on foreign soil.
Investors seeking additional global or international exposure may want to consider funds with flexible mandates that allow their managers to choose from the best companies, no matter where they are located.
Most of the top stocks each year have come from outside the U.S.
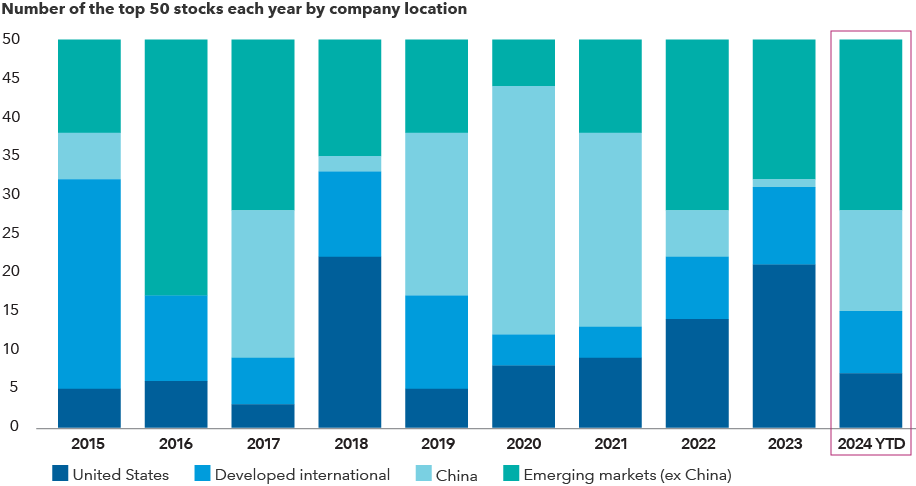
Sources: MSCI, RIMES. 2024 data as of 6/30/24. Returns in U.S. dollars. Top 50 stocks are the companies with the highest total returns in the MSCI ACWI each year.