MARKET VOLATILITY

How to handle market declines

You wouldn’t be human if you didn’t fear loss.


Nobel Prize-winning psychologist Daniel Kahneman demonstrated this with his loss aversion theory, showing that people feel the pain of losing money more than they enjoy gains. The natural instinct is to flee the market when it starts to plummet, just as greed prompts people to jump back in when stocks are skyrocketing. Both can have negative impacts.


We don’t know what the rest of this year will bring. But smart investing can overcome the power of emotion by focusing on relevant research, solid data and proven strategies. Here are seven principles that can help fight the urge to make emotional decisions in times of market turmoil.

1. Market declines are part of investing

Over long periods of time, stocks have tended to move steadily higher, but history tells us that stock market declines are an inevitable part of investing. The good news is that corrections (defined as a 10% or more decline), bear markets (an extended 20% or more decline) and other challenging patches haven’t lasted forever.

Market downturns happen frequently but don’t last forever

A four-column table shows declines of 5% or more, 10% or more, 15% or more and 20% or more in the S&P 500 Index between 1954 and 2024. For each decline, the average frequency, average length and last occurrence are shown. For 5% decline or more, the average frequency was about twice per year, average length was 46 days and last occurrence was July 2023. For 10% decline or more, the average frequency was about once every 18 months, average length was 135 days, and last occurrence was July 2023. For 15% decline or more, the average frequency was about once every three years, average length was 256 days, and last occurrence was August 2022. For 20% decline or more, the average frequency was about once every six years, average length was 402 days, and last occurrence was January 2022.

Sources: Capital Group, RIMES, Standard & Poor‘s. As of December 31, 2024. Average frequency assumes 50% recovery of lost value. Average length measures market high to market low.

The S&P 500 Index has typically dipped at least 10% about once every 18 months, and 20% or more about every six years, according to data from 1954 to 2024. While past results are not predictive of results in future periods, each downturn has been followed by a recovery and, over time, a new market high.

2. Time in the market matters, not market timing

No one can accurately predict short-term market moves, and investors who sit on the sidelines risk losing out on periods of meaningful price appreciation that follow downturns.


Every S&P 500 decline of 15% or more, from 1929 through 2024, has been followed by a recovery. The average return in the first year after each of these declines was 52%.


Even missing out on just a few trading days can take a toll. A hypothetical investment of $1,000 in the S&P 500 made in 2014 would have grown to $2,869 by the end of 2024. But if an investor missed just the 10 best trading days during that period, he or she would have ended up with just $1,571, or 45% less.

Missing just a few days in the market can hurt market returns

A bar chart that shows the value of a hypothetical $1,000 investment in the S&P 500, excluding dividends between January 1, 2014 and December 31, 2024. Each bar shows the value of the investment if invested over entire period, as well as value if missed 10, 20, 30 and 40 of the best days.

Sources: RIMES, Standard & Poor’s. As of December 31, 2024. Values in USD.

3. Emotional investing can be hazardous

Kahneman won his Nobel Prize in 2002 for his work in behavioral economics, a field that investigates how individuals make financial decisions. A key finding of behavioral economists is that people often act irrationally when making such choices.


Emotional reactions to market events are perfectly normal. Investors should expect to feel nervous when markets decline, but it’s the actions taken during such periods that can mean the difference between investment success and shortfall.

A circular graphic indicates that investors often buy when prices are high during market tops and sell when prices are low during market bottom.

Source: Capital Group.

One way to encourage rational investment decision-making is to understand the fundamentals of behavioral economics. Recognizing behaviors like anchoring, confirmation bias and availability bias may help investors identify potential mistakes before they make them.

4. Make a plan and stick to it

Creating and adhering to a thoughtfully constructed investment plan is another way to avoid making short-sighted investment decisions — particularly when markets move lower. The plan should consider a number of factors, including risk tolerance and short- and long-term goals.


One way to avoid futile attempts to time the market is with dollar cost averaging, where a fixed amount of money is invested at regular intervals, regardless of market ups and downs. This approach creates a strategy in which more shares are purchased at lower prices and fewer shares are purchased at higher prices. Over time investors pay less, on average, per share. Regular investing does not ensure a profit or protect against loss. Investors should consider their willingness to keep investing when share prices are declining.

When stock prices fall, you can get more shares for the same amount of money and lower your average cost per share

Bar chart showing price per share versus the number of shares bought, based on a hypothetical investment of $500 a month, across 12 months. In general, when the price per share is lower, the number of shares bought increases.

Source: Capital Group. Over the 12-month period, the total amount invested was $6,000, and the total number of shares purchased was 439.94. The average price at which the shares traded was $15, and the average cost of the shares was $13.64 ($6,000/439.94). Hypothetical results are for illustrative purposes only and in no way represent the actual results of a specific investment.

Retirement plans, to which investors make automatic contributions with every paycheck, are a prime example of dollar cost averaging.

5. Diversification matters

A diversified portfolio doesn’t guarantee profits or provide assurances that investments won’t decrease in value, but it does help lower risk. By spreading investments across a variety of asset classes, investors can buffer the effects of volatility on their portfolios. Overall returns won’t reach the highest highs of any single investment — but they won’t hit the lowest lows of any single investment either.


For investors who want to avoid some of the stress of downturns, diversification can help lower volatility.

Asset classes go in and out of favor

Grid of calendar-year total returns across select asset classes between 2014 and 2024. Best-performing asset classes and their returns for the year are listed first and worst-performing asset classes are listed last.

Sources: Refinitiv Datastream, RIMES. U.S. large-cap stocks — S&P 500 Index; Global small-cap stocks — MSCI All Country World Small Cap Index; International stocks — MSCI All Country World ex USA Index; Emerging markets stocks — MSCI Emerging Markets Index; U.S. bonds — Bloomberg U.S. Aggregate Index; International bonds — Bloomberg Global Aggregate Index; cash — Bloomberg U.S. Treasury Bills Index: 1–3 Months. As of December 31, 2024.

6. Fixed income can help bring balance

Stocks are important building blocks of a diversified portfolio, but bonds can provide an essential counterbalance. That’s because bonds typically have a lower correlation to the stock market, meaning that they have tended to move in the opposite direction to equities — in other words, bonds have tended to zig when the stock market zagged.

Bar chart of Bloomberg U.S. Aggregate Index and S&P 500 Index returns from 2010 to 2024 during equity corrections. The Bloomberg U.S. Aggregate Index returned -17.4% during prior equity corrections. The S&P 500 Index returned -1%.

Sources: Capital Group, Morningstar. As of December 31, 2024. Averages were calculated by using the cumulative total returns of the S&P 500 Index and the Bloomberg U.S. Aggregate Index during the nine equity market correction periods since 2010: April 23, 2010 to July 2, 2010, April 29 2011 to October 3, 2011, May 21, 2015 to August 25, 2015, November 3, 2015 to February 11, 2016, January 26, 2018 to February 8, 2018, September 20, 2018 to December 24, 2018, February 19, 2020 to March 23, 2020, January 3, 2022 to October 12, 2022, and July 31, 2023 to October 27, 2023. Corrections are based on price declines of 10% or more (without dividends reinvested) in the S&P 500 Index with at least 75% recovery.

What’s more, bonds with a low equity correlation can potentially help soften the impact of stock market losses on your overall portfolio. Funds providing this diversification can help create durable portfolios, and investors should seek bond funds with strong track records of positive returns through a variety of markets.


Though bonds may not be able to match the growth potential of stocks, they have often shown resilience in past equity declines. The market selloff in 2022 was unique in that many bonds did not play their typical safe-haven role. But in the five market declines prior to 2022, bonds — as measured by the Bloomberg U.S. Aggregate Index — rose four times and never declined more than 1%.

7. The market tends to reward long-term investors

Is it reasonable to expect 30% returns every year? Of course not. And if stocks have moved lower in recent weeks, you shouldn’t expect that to be the start of a long-term trend, either. Behavioral economics tells us recent events carry an outsized influence on our perceptions and decisions.


It’s always important to maintain a long-term perspective, but especially when markets are declining. Although stocks rise and fall in the short term, they’ve tended to reward investors over longer periods of time. Even including downturns, the S&P 500’s average annual return over all 10-year periods from 1939 to 2024 was 10.94%.

A fever line of the S&P 500 rolling 10 year average annual total returns from 1939 to 2024. Overall average was 10.91%. Two inset charts show 10-year returns from August 31, 1929 to August 31, 1939 and September 30, 1964 to September 30, 1974.

Sources: Capital Group, Morningstar, RIMES, Standard & Poor’s. As of December 31, 2024. Based on rolling monthly 10-year periods.

It’s natural for emotions to bubble up during periods of volatility. Those investors who can tune out the news and focus on their long-term goals are better positioned to plot out a wise investment strategy.

The market indexes are unmanaged and, therefore, have no expenses. Investors cannot invest directly in an index.


Past results are not predictive of results in future periods.


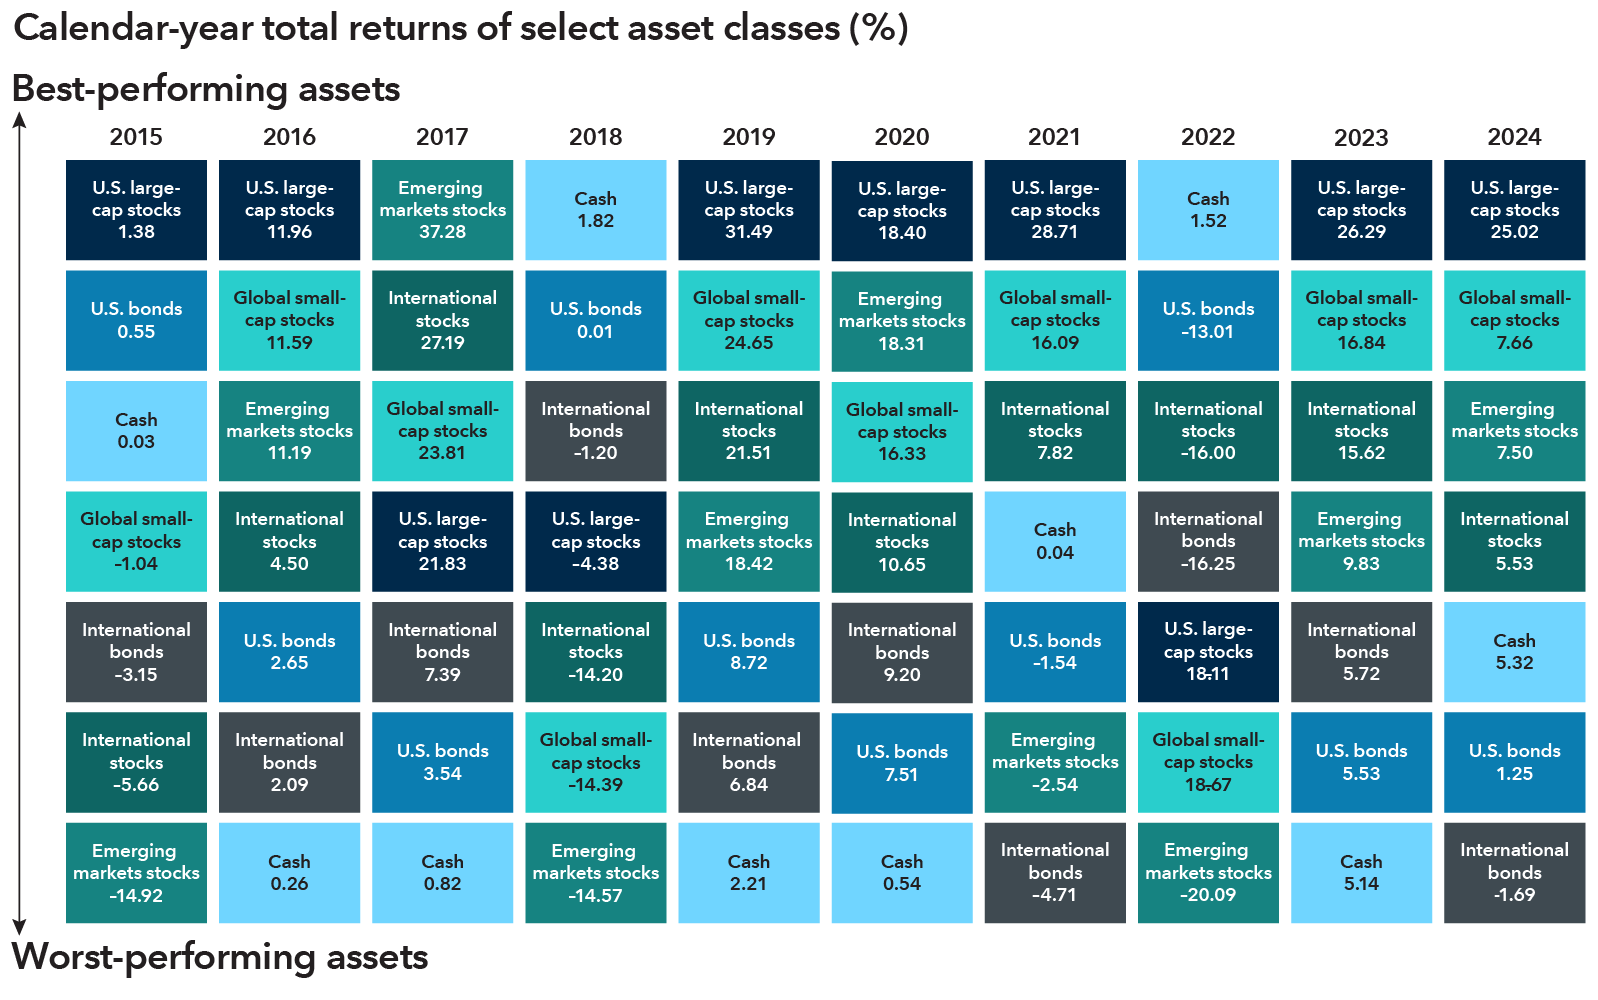
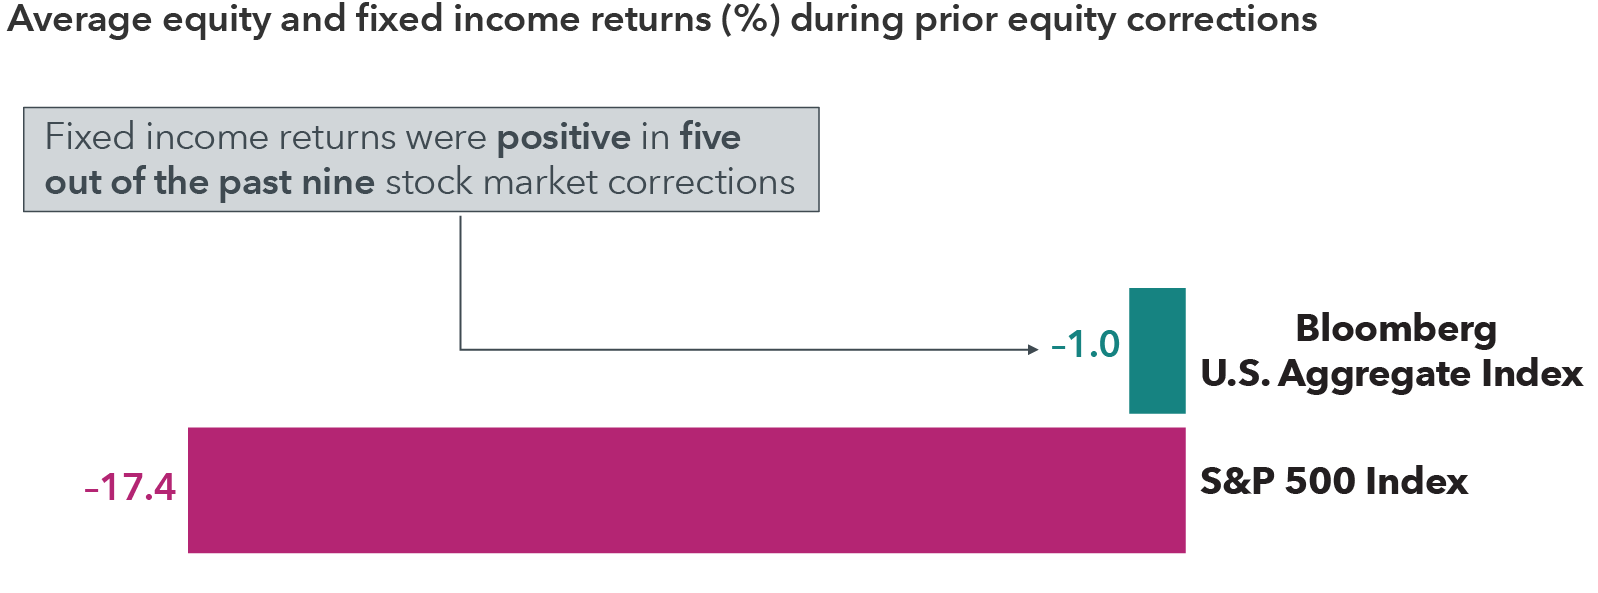
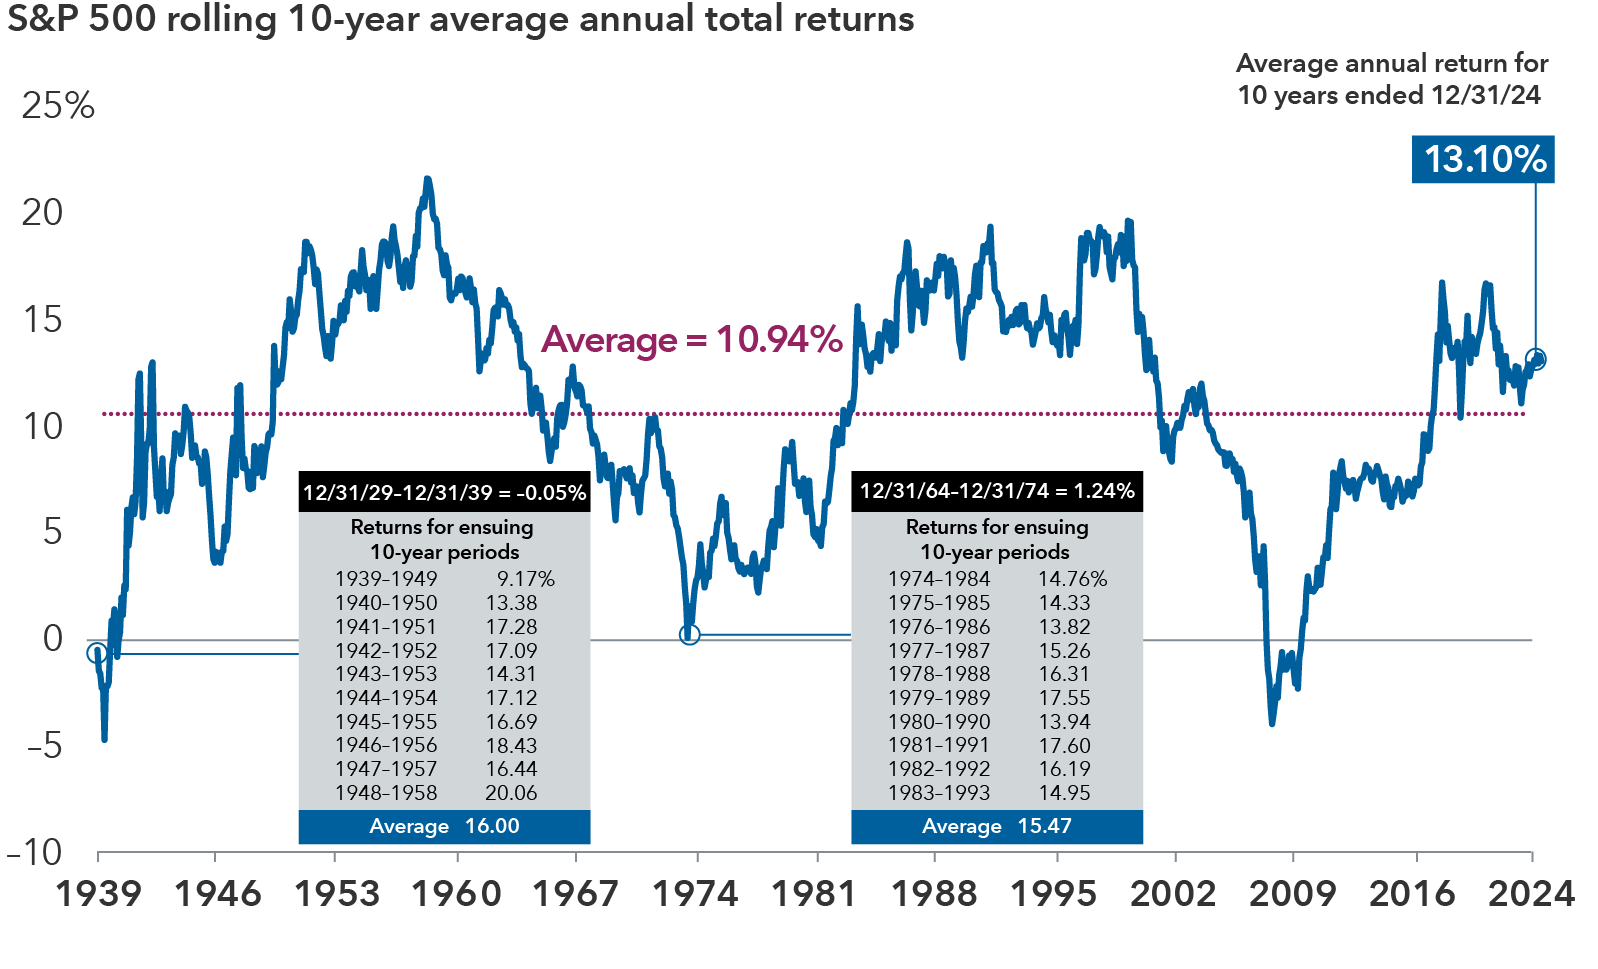
S&P 500 Index is a market capitalization-weighted index based on the results of approximately 500 widely held common stocks. MSCI All Country World Small Cap Index is designed to measure equity market results of smaller capitalization companies in both developed and emerging markets. MSCI All Country World ex USA Index is designed to measure equity market results in the global developed and emerging markets, excluding the United States. MSCI Emerging Markets Index is designed to measure equity market results in the global emerging markets. Bloomberg U.S. Aggregate Index represents the U.S. investment-grade fixed-rate bond market. Bloomberg Global Aggregate Index represents the global investment-grade fixed income markets.


MSCI does not approve, review or produce reports published on this site, makes no express or implied warranties or representations and is not liable whatsoever for any data represented. You may not redistribute MSCI data or use it as a basis for other indices or investment products.


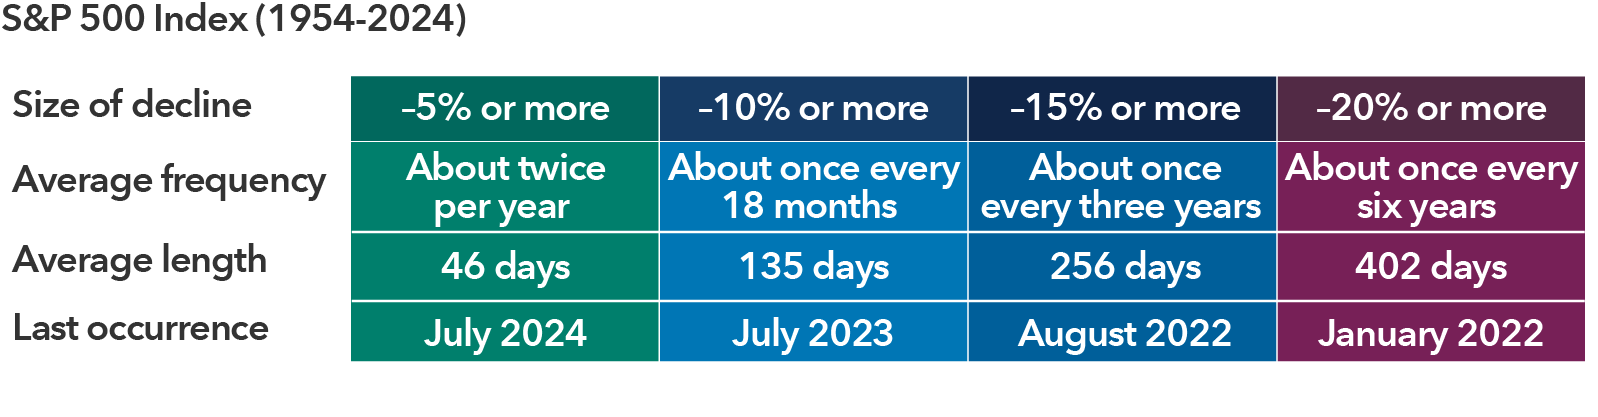
The S&P 500 Index (“Index”) is a product of S&P Dow Jones Indices LLC and/or its affiliates and has been licensed for use by Capital Group. Copyright © 202 S&P Dow Jones Indices LLC, a division of S&P Global, and/or its affiliates. All rights reserved. Redistribution or reproduction in whole or in part are prohibited without written permission of S&P Dow Jones Indices LLC.


Bloomberg® is a trademark and service mark of Bloomberg Finance L.P. and its affiliates (collectively “Bloomberg”). Bloomberg or Bloomberg’s licensors own all proprietary rights in the Bloomberg Indices. Neither Bloomberg nor Bloomberg’s licensors approves or endorses this material, or guarantees the accuracy or completeness of any information herein, or makes any warranty, express or implied, as to the results to be obtained therefrom and, to the maximum extent allowed by law, neither shall have any liability or responsibility for injury or damages arising in connection therewith.


©2025 Morningstar, Inc. All rights reserved. The information contained herein: (1) is proprietary to Morningstar and/or its content providers; (2) may not be copied or distributed; and (3) is not warranted to be accurate, complete or timely. Neither Morningstar nor its content providers are responsible for any damages or losses arising from any use of this information. Past performance is no guarantee of future results.

Investments are not FDIC-insured, nor are they deposits of or guaranteed by a bank or any other entity, so they may lose value.
Investors should carefully consider investment objectives, risks, charges and expenses. This and other important information is contained in the prospectuses and/or summary prospectuses, which can be obtained from a financial professional and should be read carefully before investing.
Statements attributed to an individual represent the opinions of that individual as of the date published and do not necessarily reflect the opinions of Capital Group or its affiliates. This information is intended to highlight issues and should not be considered advice, an endorsement or a recommendation.
All Capital Group trademarks mentioned are owned by The Capital Group Companies, Inc., an affiliated company or fund. All other company and product names mentioned are the property of their respective companies.
Use of this website is intended for U.S. residents only. Use of this website and materials is also subject to approval by your home office.
Capital Client Group, Inc.
This content, developed by Capital Group, home of American Funds, should not be used as a primary basis for investment decisions and is not intended to serve as impartial investment or fiduciary advice.