Outlook

Capital market assumptions: See what’s changed

Over the next 20 years, we believe stocks and bonds should continue providing solid annualized returns for investors, although equity gains may be muted compared to the preceding two decades. In our newly released 2025 capital market assumptions (CMAs), we outline why we anticipate average annualized returns to be in the mid- to high-single digits for stocks and for low- to mid-single digits for bonds over a 20-year horizon.


Our expectations for equities this year are slightly lower relative to last year, as valuations have expanded. In bond land, our estimates are unchanged to slightly lower than last year, because starting yields are modestly lower. 


The macroeconomic backdrop has shifted over the past year, although it is broadly in line with our expectations. The U.S. Federal Reserve, European Central Bank and several other central banks are firmly on the path of easing monetary policy. Benchmark interest rates are declining. Elections were held in about 70 countries around the world in 2024, and incumbents lost in several of them, most prominently in the U.S. and the U.K. The global economy is relatively healthy, but policy changes, including potential conflicts on tariffs and trade, could dampen growth in many countries.


On the fiscal front, governments are facing rising spending pressure from areas like infrastructure, defense and their aging populations. While contributing in some ways to higher productivity in the economy, persistent fiscal deficits are also raising public debt burdens, leading us to expect interest rates that are higher than what we have seen in the prior two decades.


We expect the U.S. economy to grow by a 2.3% annualized rate over the long term and for inflation to average 2.25% annualized. The U.S. is likely to continue to lead the global economy. The U.S. economy thrives in an enviable position due to its robust entrepreneurial culture, deep capital markets that fund both startups and mature companies, a synergy between academia, research institutes and business, immigration policies that attract global talent, and a flexible labor market. 

U.S. economic growth continues to outpace peers

The table compares long-term real GDP percentage estimates with long-term inflation percentage estimates for 2024 and 2025 by region. The U.S. is forecast to have 2.3% GDP and inflation in 2024 and 2025. Emerging markets GDP is forecast at 3.2% in 2025 and 3% in 2024, with inflation of 2.4% and 2.4% respectively. Japan GDP is forecast at 0.8% in 2025 and 0.5% in 2024, with respective inflation forecast at 1.8% and 1.5%. Eurozone GDP is forecast at 1.3% in both 2024 and 2025 with inflation at 2% in each year. The U.K. GDP forecast is 1.3% for 2025 and 1% for 2024 with inflation forecast at 2.3% for both years.

Source: Capital Group. Estimates as of September 30, 2024.

Many governments and companies around the world are making efforts to increase their productivity and boost long-term growth prospects. Of note, improvements in corporate governance in Japan and a focus on profitability over the past couple of years have been well-documented. And Japan’s stock market has made sharp gains, as investors have recognized those changes and the resulting improvements in corporate profitability.


South Korea has made similar strides, and we are seeing a gradual shift in approach in several European countries. 


We have pegged our estimates for Europe’s economy by 1.3% in aggregate, recognizing that there will be heterogeneity within the region. We expect Japan’s GDP to expand by 0.8% and for emerging markets economies to grow by a 3.2% annualized rate.


As other countries catch up, relative to the U.S., we expect the U.S. dollar to give up some of its current strength relative to other currencies, and we expect it will depreciate at an annualized rate of 0.5% over the next two decades. In the near term, our economists expect the dollar to maintain its strength given the leading technological edge of the U.S., the higher productivity of its economy and its higher interest rates relative to other developed economies.


Rising debt burdens in the U.S. and several other major economies remain a watch item for us. The economic regime of the first two decades of the 21st century, where monetary policy was the primary policy lever, has given way to an environment with a more active role for fiscal policy. This will likely lead to higher interest rates than those of the prior two decades and greater frictions between monetary and fiscal policy, although we do not expect rates to shoot up to excessive levels. 

Equity returns trimmed after strong gains and increased market concentration 

Over the past two years, global equities have enjoyed a remarkable surge, causing us to temper our estimates relative to last year. We now expect equity returns in the mid- to high-single digits. Further gains will have to come from earnings growth and less from an expansion of multiples. Overall, we expect price-to-earnings (P/E) multiples to contract in most regions, with modest expansion in emerging markets.

GK_CMAs_WP_charts_Equties-return

Source: Capital Group. The 2025 estimates are as of December 31, 2024, with valuations as of September 2024. The 2024 estimates are as of December 31, 2023, with valuations as of September 2023.

U.S. equities

Under our CMAs framework, we foresee earnings growth to become a larger part of returns over the next 20 years, especially as U.S. equities have experienced vast price appreciation and multiple expansion. We now estimate annualized returns of 6.3%, down from last year’s estimate of 6.9%.


Widely known as the Magnificent Seven, this subset of large tech companies has posted stronger profits and share growth versus the broader market, while they hold significant weightings in various indices. 


In addition to looking at traditional valuation metrics, we also utilize cyclically adjusted P/E ratios, in which we consider cyclical earnings growth over a 10-year period. When looking at extended periods of market gains, in addition to the traditional mean reversion framework, we utilize a fundamentally oriented valuation framework that can help avoid the dangers of being stuck in a value trap. 

Earnings growth

Earnings per share (EPS) growth is estimated to average 3.6% in the U.S., 1.0% in developed markets outside the U.S. and 0.6% in emerging markets. Over the past decade, EPS growth has been stronger in the U.S. and Japan than at any time since 1969. It should not be surprising that EPS expansion has been the greatest among growth stocks, given the prevalence of share buybacks by companies for their extensive use of stock options in total employee compensation.

Earnings growth is expected to drive future returns for equities

Three sets of bar charts compare 10-year earnings-per-share (EPS), EPS estimates, total cyclical earnings growth and estimated total cyclical earnings growth among three indexes. For the MSCI USA, it shows 3.8%, 3.6% 3.4% and 2.3%, respectively. For the MSCI World ex U.S., it shows 0.7%, 1.0%, 2.1% and 1.4%, respectively. And for MSCI Emerging Markets, the bar chart shows 1.0%, 0.6%, 6.6% and 3.2%, respectively.

Source: Capital Group, MSCI. Data as of September 30, 2024. Estimates are 20-year forward figures and the non-estimated are 10-year trailing figures.

Non-U.S. developed markets

European stocks have powered ahead even as domestic economies have struggled with anemic growth, the lingering effects of the 2022 energy shock, political turmoil and policy uncertainty. Return expectations for this group are estimated at 6.0% versus 6.7% last year. The overhang of potential tariffs, trade tensions and slower exports to China continue to weigh on prospects. Earnings growth has also been more muted in Europe.

Japan

We expect Japanese equities to benefit from regulatory improvements including better corporate governance, wider profit margins and higher return on invested capital, and return on equity. These developments have boosted Japanese EPS, which have grown 6.9% over the past decade. As these trends continue, we estimate a 7.0% annualized return over 20 years, supported by meaningful appreciation of the yen against the dollar.

Emerging markets

Emerging markets (EM) are one of the most attractive areas in public stock markets, with strong economies such as India. Meanwhile, China’s growth rate remains positive, although it has slowed. Economic growth estimates for EM are higher and valuations remain supportive, which should translate to higher expected returns. For EM, we’re estimating returns of 6.8%, down from 7.6% in last year’s CMAs. 


However, weak corporate governance in many countries, capital markets that are still maturing, low labor participation, unstable infrastructure, contentious politics and high family ownership of corporations can prevent the flow of wealth creation from accruing to public stock markets.

Fixed income outlook: Brighter days ahead 

Overall, the outlook is bright for long-term fixed income investors, with return expectations for bonds in the low- to mid-single digits. We believe return opportunities in fixed income over the coming two decades will be higher than what was realized in the prior 20 years, while our expectations for global equities are lower than the prior two decades.


That said, most of our fixed income return expectations have decreased slightly since last year as starting yields are modestly lower across rates and credit markets globally (as of September 30, 2024) and spreads have compressed meaningfully. 

Global rates

Ongoing concerns about the stickiness of certain inflation components and the potential for inflationary fiscal policy could result in higher policy and cash rates for some time. Although questions over the sustainability of high U.S. public debt could cap how high bond yields rise before potentially triggering various forms of government intervention.


Over a 20-year horizon, we expect the U.S. Treasury yield curve to normalize toward its historical median and for the Treasury yield curve to be slightly steeper overall than our 2024 estimate. We have pegged our estimate for the 10-year U.S. Treasury yield at 3.9% over a 20-year horizon.


Global central banks have made good progress at mitigating and reversing inflationary trends. We expect higher interest rates to persist across major markets amid relatively robust economic growth. Overall, our expectations for 10-year yields for the eurozone, Japan and Switzerland are less than 3%, while 10-year rates for the U.K., Australia and Canada are clustered around 4%. 

Estimates for fixed income asset classes

GK_CMAs_WP_charts_FI-asset-classes

Source: Capital Group. The 2025 estimates are as of December 31, 2024, with valuations as of September 2024. The 2024 estimates are as of December 31, 2023, with valuations as of September 2023.

U.S. corporate credit

We expect U.S. investment grade (IG), BBB/Baa and above, corporate spreads to widen and remain above their historical median, reflective of an asset class that has experienced lengthening duration and a higher proportion of BBB-rated bonds in the index. Slightly wider spread assumptions are partly a function of a steepening rates curve and its impact on the long-duration asset class. IG credit has also historically captured a large percentage of starting yield. The option-adjusted spread (OAS) has compressed meaningfully for both the Bloomberg U.S. Aggregate Index and the Bloomberg U.S. Corporate Index since 2023, and our return expectations for those indexes are 4.6% and 5.3%, respectively.


We believe high yield spreads and defaults should remain below historical medians, because we expect the asset class to continue moving higher in quality and lower in duration. The risk of defaults hasn’t dissipated entirely, but the big shift in leveraged buyout financing from high yield to leveraged loan and private markets has contributed to a decline in default rates. We expect this trend to continue, given private equity’s strong preference for prepayable debt over callable bonds, which is characteristic of high-yield markets. Our estimates for U.S. high yield are 6.2% annualized returns, 30 basis points lower than last year. 

Bonds may produce higher returns relative to history

Bar chart compares five asset classes in three categories: 2025 CMAs, 10-year annualized returns and 20-year annualized returns. Cash (USD) has returns of 3.4%, 1.7% and 1.6% in the respective three return periods. U.S. Treasury intermediate term list returns of 4.0%, 1.8% and 3.4% over the three respective return periods. U.S. TIPS has returns of 4.1%, 2.6% and 3.7% in the three respective periods. U.S. aggregate shows returns of 4.6%, 1.9% and 3.3% over the three respective periods. Lastly, the global aggregate shows returns of 4.0%, 0.8% and 2.6% over the three time frames.

Source: Capital Group. All asset classes reflect asset class proxy benchmarks used in CMAs in U.S. dollars. TIPS = Treasury Inflation-Protected Securities. See CMAs analysis methodology notes on important disclosures slide. See Asset classes and benchmark index definitions page for asset class proxy benchmark information. Past results are not predictive of results in future periods. Data as of September 30, 2024. 

Mortgage-backed securities

As the Fed unwinds its quantitative easing program, agency mortgage-backed securities (MBS) could see higher demand from certain investors who are more price sensitive. Against this backdrop, we expect the OAS for agency MBS to widen modestly. We expect agency MBS annualized returns of about 4.5%, lower than last year.


The commercial mortgage-backed securities (CMBS) market has experienced significant devaluation since the COVID-19 pandemic, but the Federal Reserve’s dovish rhetoric brought some stability, reducing refinancing risk and leading to spread compression in 2024. The CMBS market is expected to continue healing, with rates and spreads improving, particularly for high-quality assets. Despite the challenges, CMBS is projected to have strong returns in securitized markets over the next few years. The market’s recovery is anticipated to be front-loaded, with yield and spread normalizing over the next five years. 

Emerging markets debt

Our return expectations are 7.0% per annum for dollar-denominated debt and 6.8% for local currency EM debt. The outlook for EM debt, both sovereign and corporate, will likely be negative if tariffs weigh on global growth. Manufacturing exporters are likely at more risk than commodity producers. A more positive scenario is also plausible if tariffs are modest, inflation remains well contained, U.S. growth remains robust, and the Fed can deliver gradual rate cuts.

Stock-bond dynamics

In regard to risk-return dynamic and portfolio construction, we take a broader look at which asset classes may produce an expected return, compared to their respective risk profile.


The risk-return chart below shows the spectrum of equity and fixed income asset classes available for asset allocators to build diversified portfolios.


U.S. equities stand out among major equity asset classes, when looking at risk-adjusted returns on an absolute basis. Within fixed income, U.S. high yield and EM debt across local and U.S.-dollar-denominated are expected to have an attractive combination of high returns and low standard deviation.

The exhibit presents a scatter chart that outlines the risk versus return assumptions for various asset classes. The asset classes listed are: Cash (USD): Return = 3.4%, Standard Deviation = 0.5%. Municipal bond: Return = 3.3%, Standard Deviation = 4.7%. U.S. Treasury short term: Return = 3.75%, Standard Deviation = 2.1%. U.S. Treasury intermediate term: Return = 4.0%, Standard Deviation = 5.6%. U.S. Treasury long term: Return = 4.5%, Standard Deviation = 11.4%. U.S. TIPS: Return = 4.1%, Standard Deviation = 5.7%. U.S. aggregate: Return = 4.6%, Standard Deviation = 4.2%. U.S. corporate: Return = 5.3%, Standard Deviation = 6.4%. U.S. corporate long duration: Return = 5.4%, Standard Deviation = 11.2%. U.S. high yield: Return = 6.2%, Standard Deviation = 8.0%. Global aggregate: Return = 4.03%, Standard Deviation = 6.0%. Non-U.S. global aggregate: Return = 3.44%, Standard Deviation = 8.1%. Emerging markets debt (USD): Return = 7.0%, Standard Deviation = 8.9%. Emerging markets debt (local): Return = 6.8%, Standard Deviation = 11.9%. U.S. equity: Return = 6.3%, Standard Deviation = 15.1%. U.S. small cap equity: Return = 7.2%, Standard Deviation = 19.4%. Developed markets equity: Return = 6.2%, Standard Deviation = 15.5%. All country world equity: Return = 6.3%, Standard Deviation = 15.7%. All country world small cap equity: Return = 6.4%, Standard Deviation = 18.2%. Non-U.S. developed markets equity: Return = 6.0%, Standard Deviation = 16.7%. Emerging markets equity: Return = 6.8%, Standard Deviation = 20.7%.

Source: Capital Group. As of December 31, 2024, with valuations as of September 30, 2024. All assumptions are for market asset classes only and are reviewed at least annually. These figures represent the views of a small group of investment professionals based on their individual research and are approved by the Capital Market Assumptions Oversight Committee. They should not be interpreted as the view of Capital Group as a whole. As Capital Group employs The Capital System™, the views of other individual analysts and portfolio managers may differ from those presented here. They are provided for informational purposes only and are not intended to provide any assurance or promise of actual returns. They reflect long-term projections of asset class returns and are based on the respective benchmark indexes or other proxies and therefore do not include any outperformance gain or loss that may result from active portfolio management. Note that the actual results will be affected by any adjustments to the mix of asset classes. All market forecasts are subject to a wide margin of error.

MIJB

Michelle J. Black is a solutions portfolio manager with 30 years of investment industry experience (as of 12/31/2024). She holds a bachelor’s in business administration from the University of Southern California. She also holds the Certified Investment Management Analyst® and Certified Private Wealth Advisor® designations, is a member of the Investments & Wealth Institute and serves on the CIMA commission.

eswarie-balan-color-600x600

Eswarie Balan is a solutions analyst with 14 years of investment industry experience (as of 12/31/2024). She holds a master's degree in economics from Columbia University and bachelor's degrees in actuarial science, finance and economics from the Wharton School of the University of Pennsylvania.

tryggvi-gudmundsson-color-600x600

Tryggvi Gudmundsson is an economist with 16 years of investment industry experience (as of 12/31/2024). He holds a PhD from the London School of Economics and Political Science, master’s and bachelor’s degrees in economics from the University of Iceland.

Glossary


Capital market assumptions: Long-term projections of the future performance of asset class returns based on their respective benchmark indexes that incorporate analysis and observations.

Duration: The measurement of the sensitivity of the price of a bond or debt instrument to the change in interest rates. The higher the duration, the more a bond’s price will drop as interest rates rise (and the greater the interest rate risk).

Magnificent Seven: The seven largest contributors to returns in the S&P 500 in 2023. The companies are Alphabet, Amazon, Apple, Meta, Microsoft, Nvidia and Tesla.

Mean reversion: The assumption that an asset’s price will tend to converge with its average price over time, despite long-term variations.

Multiple: A way of assessing the value of a company by comparing it to peers, usually by a ratio. This helps to quantify a company's health and find investment opportunities.

Option-adjusted spread: A yield-spread calculation used to value securities with embedded options.


Price-to-earnings (P/E): The ratio for valuing a company that measures its current share price relative to its earnings per share (EPS).


Standard deviation: A statistical measure of dispersion of the observed return that depicts how widely a stock or portfolio’s returns varied over a certain period of time. When a stock or portfolio has a high standard deviation, the predicted range of performance is wide, implying greater volatility.


Value trap: A stock that appears to be valued attractively but ultimately fails to provide outsized gains for investors.


Yield curve: An illustration of the yields on similar bonds across various maturities. An inverted yield curve occurs when yields on short-term bonds are higher than yields on long-term bonds. Yield curve steepening occurs when long-term rates rise more than short-term rates, or short-term rates fall more than long-term rates.


Asset classes and benchmark index definitions

 
All indexes are unmanaged.


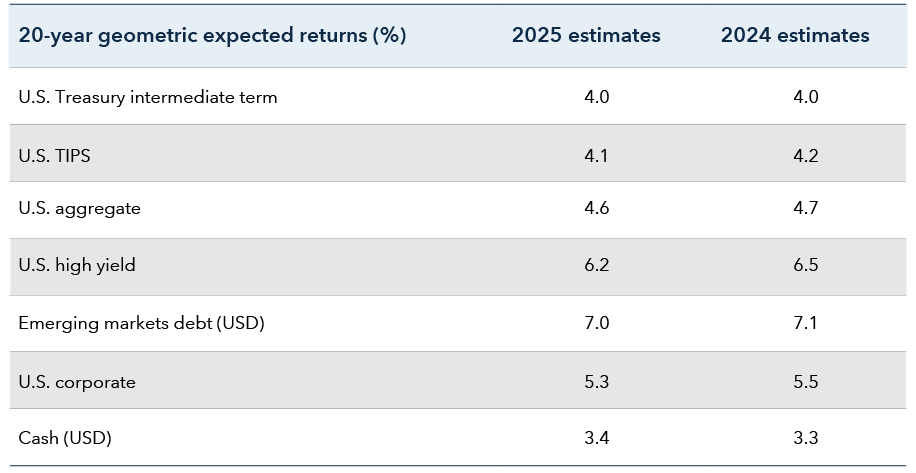
Cash (USD): The FTSE 3-Month U.S. T-Bill Index Series is intended to track the daily performance of three-month U.S. Treasury bills. The indexes are designed to operate as a reference rate for a series of funds.


U.S. Treasury short term: The Bloomberg 1–5 Year U.S. Treasury Index measures USD-denominated, fixed-rate, nominal debt issued by the U.S. Treasury with maturities of one to five years.


U.S. Treasury intermediate term: The Bloomberg 5–10 Year U.S. Treasury Index measures USD-denominated, fixed-rate, nominal debt issued by the U.S. Treasury with maturities of five to 10 years.


U.S. Treasury long term: The Bloomberg 10–20 Year U.S. Treasury Index measures USD-denominated, fixed-rate, nominal debt issued by the U.S. Treasury with maturities of 10 to 20 years. The Bloomberg 20+ Year U.S. Treasury Index measures USD-denominated, fixed-rate, nominal debt issued by the U.S. Treasury with maturities of 20 years or more.


U.S. TIPS: The Bloomberg U.S. Treasury Inflation-Protected Securities (TIPS) Index consists of investment-grade, fixed-rate, publicly placed, USD-denominated and non-convertible inflation-protected securities issued by the U.S. Treasury that have at least one year remaining to maturity and $250 million par amount outstanding.


U.S. aggregate: The Bloomberg U.S. Aggregate Bond Index represents the U.S. investment-grade fixed-rate bond market.


U.S. corporate: The Bloomberg U.S. Corporate Investment Grade Index represents the universe of investment-grade, publicly issued U.S. corporate and specified foreign debentures and secured notes that meet the specified maturity, liquidity and quality requirements.


U.S. corporate long duration: The Bloomberg U.S. 20+ Year AAA-A Corporate Bond Liquid Index measures fixed-rate, taxable corporate bonds with at least 20 years remaining to maturity. It includes USD-denominated securities issued by U.S. and non-U.S. industrial, utility and financial issuers with an index rating of at least AAA and at least $750 million par amount outstanding and excludes subordinated debt.


U.S. high yield: The Bloomberg U.S. Corporate High Yield Index 2% Issuer Cap covers the universe of fixed-rate, non-investment-grade debt. The index limits the maximum exposure of any one issuer to 2%.


Non-U.S. global aggregate: The Bloomberg Global Aggregate ex-USD Index measures the performance of global investment-grade bonds, excluding the United States. This multicurrency benchmark includes Treasury, government-related, corporate and securitized fixed-rate bonds from both developed and emerging market issuers.


Global aggregate: The Bloomberg Global Aggregate Bond Index measures the performance of global investment-grade bonds. This multicurrency benchmark includes Treasury, government-related, corporate and securitized fixed-rate bonds from both developed and emerging market issuers.


Emerging markets debt (USD): The J.P. Morgan Emerging Market Bond Index (EMBI) Global Diversified is a uniquely weighted emerging markets debt benchmark that tracks total returns for USD-denominated bonds issued by emerging market sovereign and quasi-sovereign entities.


Emerging markets debt (local): The J.P. Morgan Government Bond Index — Emerging Markets (GBI-EM) Global Diversified covers the universe of regularly traded, liquid fixed-rate, domestic-currency emerging markets government bonds to which international investors can gain exposure.


Municipal bonds: The Bloomberg Municipal Bond Index is a market-value-weighted index designed to represent the long-term investment-grade tax-exempt bond market.


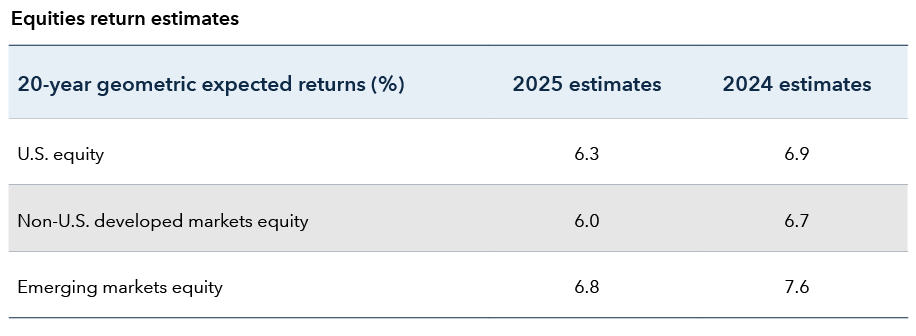
U.S. equity: The MSCI USA Index is a free-float-adjusted, market-capitalization-weighted index that measures the U.S. portion of the world market. Results reflect dividends gross of withholding taxes.


U.S. small-cap equity: The MSCI USA Small Cap Index is a free-float-adjusted, market-capitalization-weighted index that measures the performance of the small-cap segment of U.S. markets.


Developed markets equity: The MSCI World Index is a free-float-adjusted, market-capitalization-weighted index that measures equity market results in developed global markets, consisting of 23 developed market country indexes.


All-country world equity: The MSCI All Country World Index (ACWI) is a free-float-adjusted, market-capitalization-weighted index that measures equity market results in global developed and emerging markets, consisting of more than 40 developed and emerging markets country indexes.


All-country world small-cap equity: The MSCI All Country World Small Cap Index is a free-float-adjusted, market-capitalization-weighted index that measures equity market results of smaller capitalization companies in both developed and emerging markets. Results reflect dividends net of withholding taxes.


Non-U.S. developed markets equity: The MSCI World ex USA Index is a free-float-adjusted, market-capitalization-weighted index that measures equity market results in global developed markets, consisting of 22 of 23 developed market country indexes, excluding the United States.


Emerging markets equity: The MSCI Emerging Markets Index is a free-float-adjusted, market-capitalization-weighted index that measures equity market performance of emerging markets.


Agency mortgage-backed securities: The Bloomberg U.S. Mortgage-Backed Securities Index measures a market-value-weighted index that covers fixed-rate, publicly placed, dollar-denominated obligations issued by the U.S. Treasury, U.S. government agencies, quasi-federal corporations, corporate or foreign debt guaranteed by the U.S. government, and the mortgage-backed pass-through securities of Federal National Mortgage Association, the Federal Home Loan Mortgage Corporation and the Government National Mortgage Association.


Important Information


This analysis represents the views of a small group of investment professionals based on their individual research and are approved by the Capital Market Assumptions Oversight Committee. They should not be interpreted as the view of Capital Group as a whole. As Capital Group employs The Capital System, the views of other individual analysts and portfolio managers may differ from those presented here. They are provided for informational purposes only and are not intended to provide any assurance or promise of actual returns. They reflect long-term projections of asset class returns and are based on the respective benchmark indices, and therefore do not include any outperformance gain or loss that may result from active portfolio management. Note that the actual results will be affected by any adjustments to the mix of asset classes. All market forecasts are subject to a wide margin of error.


Bond ratings, which typically range from AAA/Aaa (highest) to D (lowest), are assigned by credit rating agencies such as Standard & Poor’s, Moody’s and/or Fitch, as an indication of an issuer’s creditworthiness.


Lower rated bonds are subject to greater fluctuations in value and risk of loss of income and principal than higher rated bonds.


While not directly correlated to changes in interest rates, the values of inflation linked bonds generally fluctuate in response to changes in real interest rates and may experience greater losses than other debt securities with similar durations.


Bloomberg® is a trademark and service mark of Bloomberg Finance L.P. and its affiliates (collectively “Bloomberg”). Bloomberg or Bloomberg’s licensors own all proprietary rights in the Bloomberg Indices. Neither Bloomberg nor Bloomberg’s licensors approves or endorses this material, or guarantees the accuracy or completeness of any information herein, or makes any warranty, express or implied, as to the results to be obtained therefrom and, to the maximum extent allowed by law, neither shall have any liability or responsibility for injury or damages arising in connection therewith.


London Stock Exchange Group plc and its group undertakings (collectively, the “LSE Group”). © LSE Group 2025. FTSE Russell is a trading name of certain of the LSE Group companies. FTSE® and Russell® are trademarks of the relevant LSE Group companies and are used by any other LSE Group company under license. All rights in the FTSE Russell indexes or data vest in the relevant LSE Group company which owns the index or the data. Neither LSE Group nor its licensors accept any liability for any errors or omissions in the indexes or data and no party may rely on any indexes or data contained in this communication. No further distribution of data from the LSE Group is permitted without the relevant LSE Group company’s express written consent. The LSE Group does not promote, sponsor or endorse the content of this communication.


MSCI has not approved, reviewed or produced this report, makes no express or implied warranties or representations and is not liable whatsoever for any data in the report. You may not redistribute the MSCI data or use it as a basis for other indices or investment products.


This report, and any product, index or fund referred to herein, is not sponsored, endorsed or promoted in any way by J.P. Morgan or any of its affiliates who provide no warranties whatsoever, express or implied, and shall have no liability to any prospective investor, in connection with this report. J.P. Morgan disclaimer: https://www.Jpmm.com/research/disclosures.


The S&P 500 Index is a product of S&P Dow Jones Indices LLC and/or its affiliates and has been licensed for use by Capital Group. Copyright © 2025 S&P Dow Jones Indices LLC, a division of S&P Global, and/or its affiliates. All rights reserved. Redistribution or reproduction in whole or in part is prohibited without written permission of S&P Dow Jones Indices LLC.

Investments are not FDIC-insured, nor are they deposits of or guaranteed by a bank or any other entity, so they may lose value.
Investors should carefully consider investment objectives, risks, charges and expenses. This and other important information is contained in the fund prospectuses and summary prospectuses, which can be obtained from a financial professional and should be read carefully before investing.
Statements attributed to an individual represent the opinions of that individual as of the date published and do not necessarily reflect the opinions of Capital Group or its affiliates. This information is intended to highlight issues and should not be considered advice, an endorsement or a recommendation.
All Capital Group trademarks mentioned are owned by The Capital Group Companies, Inc., an affiliated company or fund. All other company and product names mentioned are the property of their respective companies.
Use of this website is intended for U.S. residents only. Use of this website and materials is also subject to approval by your home office.
Advisory services offered through Capital Research and Management Company (CRMC) and its RIA affiliates. Capital Client Group, Inc., member FINRA.
This content, developed by Capital Group, home of American Funds, should not be used as a primary basis for investment decisions and is not intended to serve as impartial investment or fiduciary advice.