Anchor menus with fixed income
DEFINED CONTRIBUTION FOCUS FUNDS
Prudent true core and core plus
The Bond Fund of America® (intermediate core bond) and American Funds Strategic Bond Fund (intermediate core-plus bond) seek to manage risk prudently while providing a mix of capital preservation, diversification, income and inflation protection to varying degrees§
-
-
Diversification from equities
When stocks struggle, owning bonds with a low correlation to equities can result in lower portfolio volatility.
Low five-year correlation to the S&P 500 Index
The Bond Fund of America (R-6)
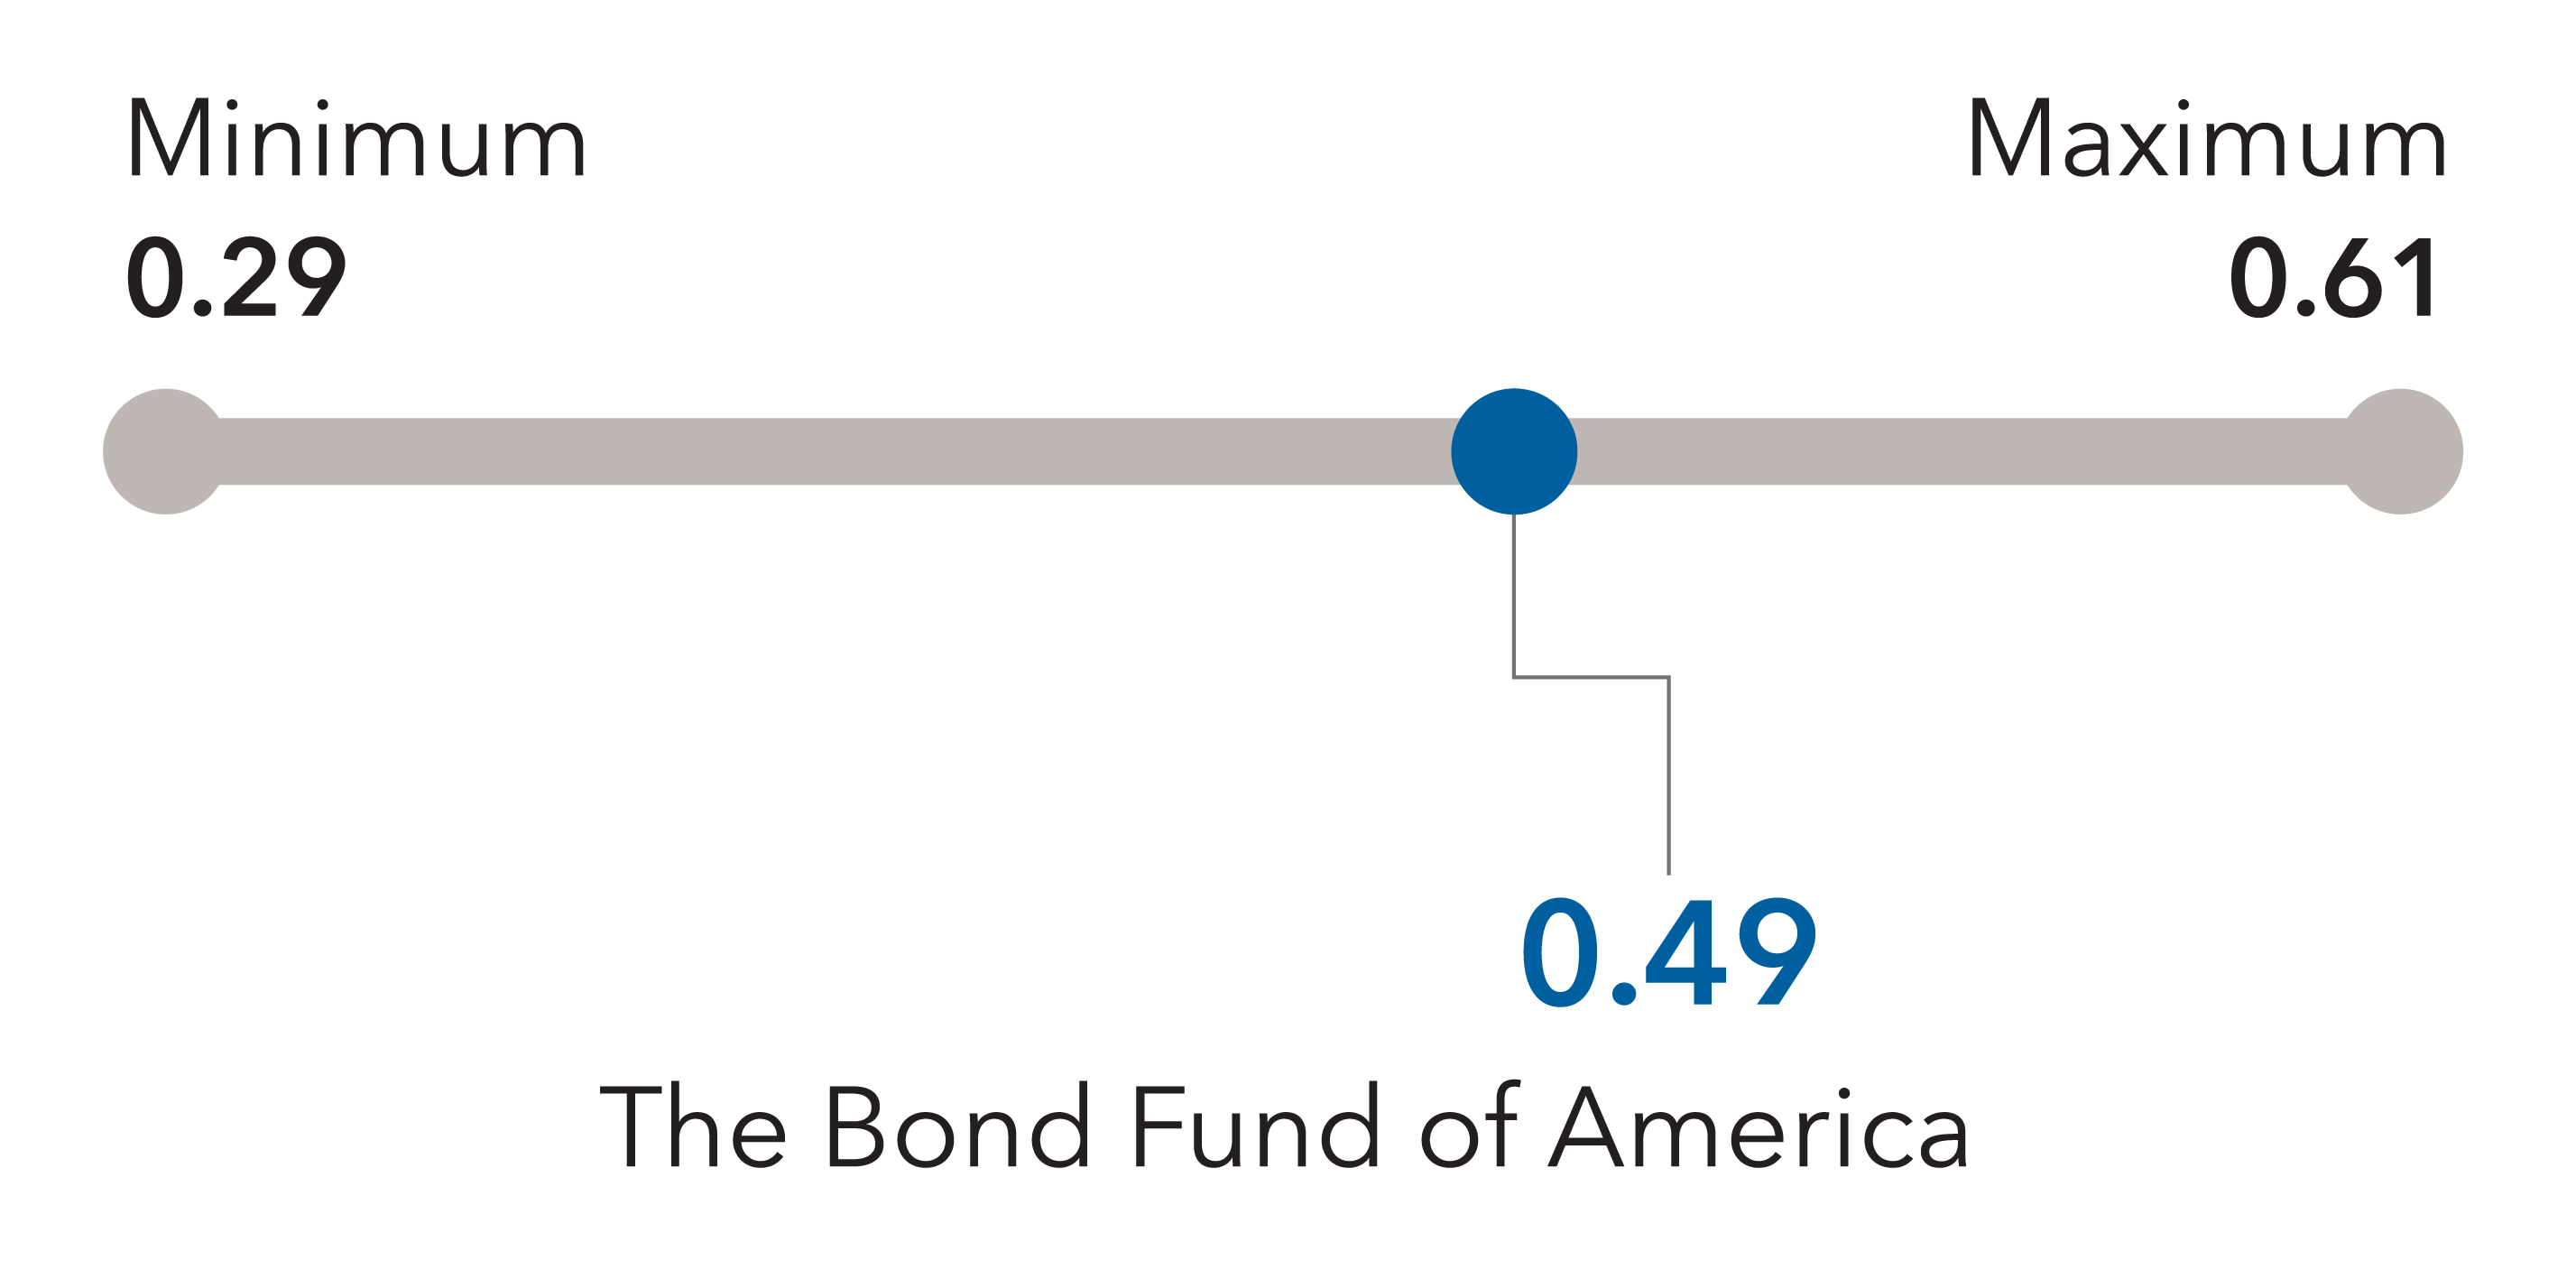
Shown within the range for funds in the Morningstar Intermediate Core Bond category. As of 12/31/2023. Correlation ranges from 1 to -1 and measures how two securities move in relation to each other. A positive correlation close to 1 implies that as one moved, either up or down, the other moved in “lockstep,” in the same direction. A negative correlation close to -1 indicates the two have moved in the opposite direction.
American Funds Strategic Bond Fund (R-6)
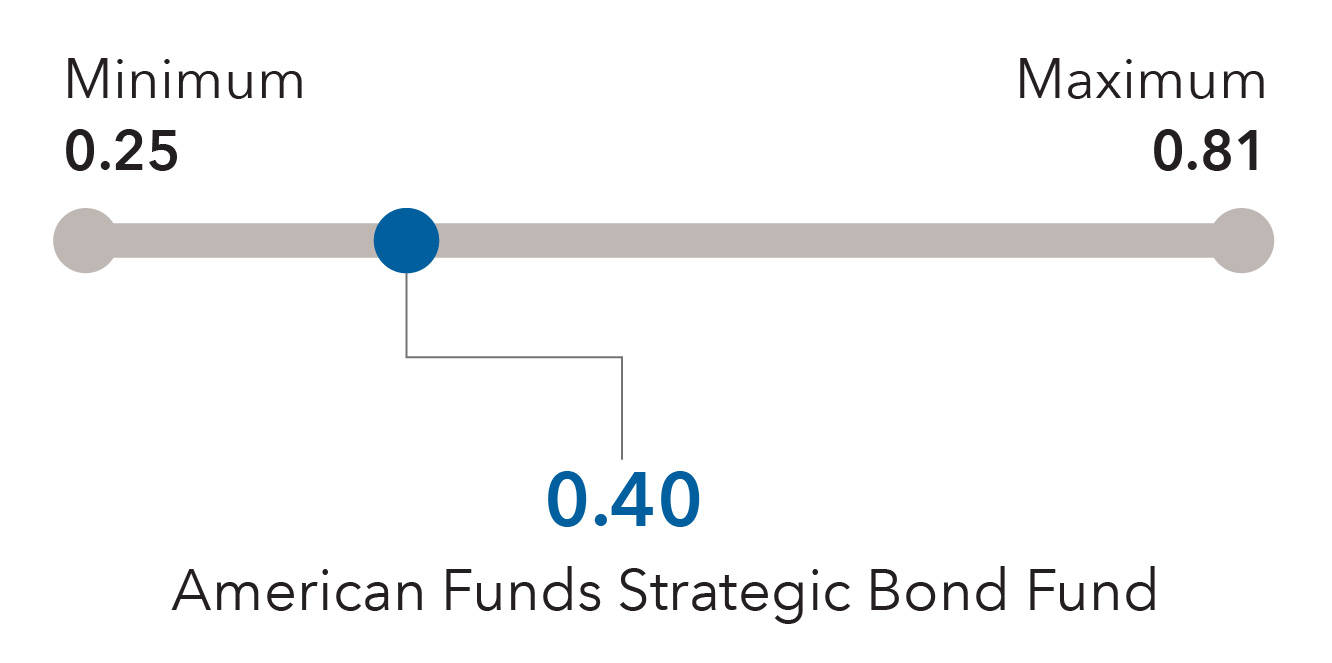
Shown within the range for funds in the Morningstar Intermediate Core-Plus Bond category. As of 12/31/2023. Correlation ranges from 1 to -1 and measures how two securities move in relation to each other. A positive correlation close to 1 implies that as one moved, either up or down, the other moved in “lockstep,” in the same direction. A negative correlation close to -1 indicates the two have moved in the opposite direction.
-
Capital preservation
A fixed income allocation should help protect principal in most market environments.
The Bond Fund of America (R-6)
Positive returns in 88% of monthly rolling three-year periods since January 1, 2009
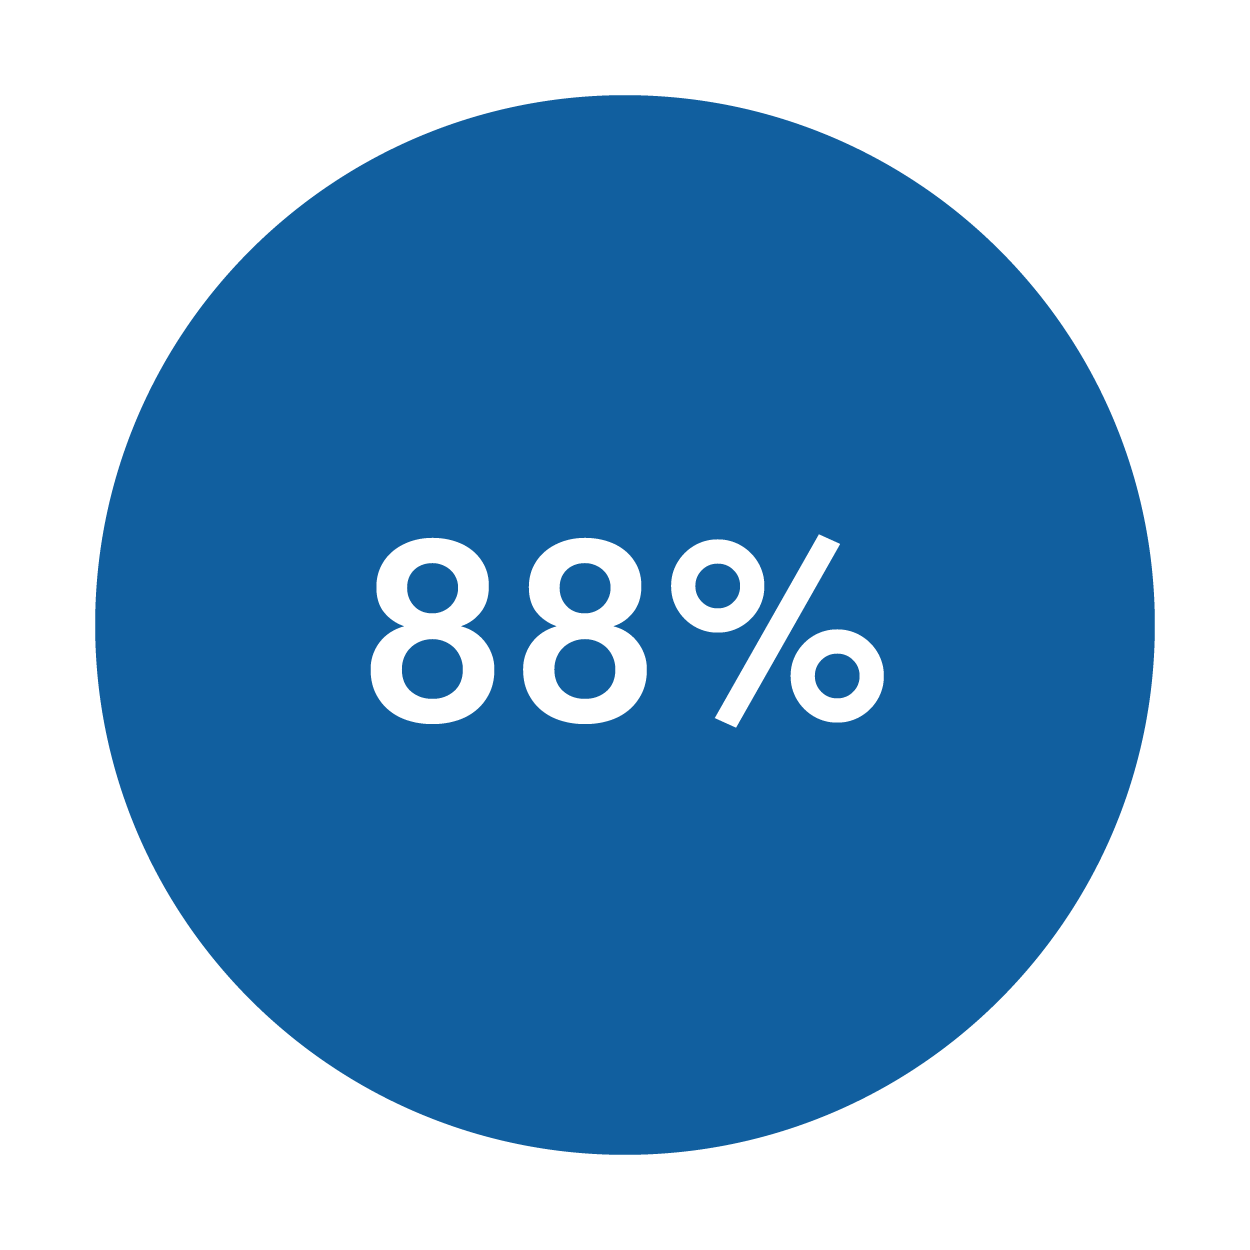
Based on monthly data for the period January 1, 2009, through December 31, 2023. On January 1, 2009, the fund’s strategy was repositioned from core plus to core fixed income, with its prospectus and guidelines adjusted accordingly.
American Funds Strategic Bond Fund (R-6)
Positive returns in 81% of monthly rolling three-year periods since March 31, 2016
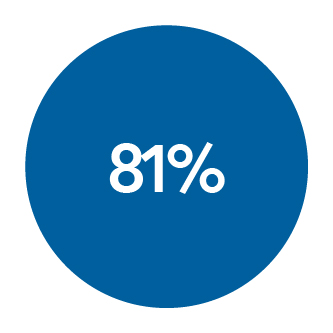
Based on 46 montly rolling three-year periods from March 31, 2016, to December 31, 2023. The fund's inception was March 18, 2016.
-
Income
Providing dependable income is a central function of a bond allocation.
Yield potential
The Bond Fund of America (R-6)
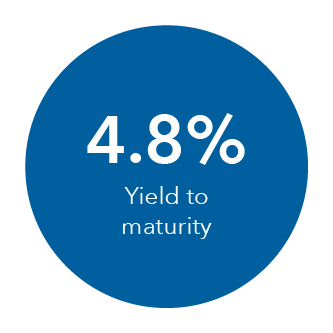
As of 12/31/2023. Yield to maturity.
American Funds Strategic Bond Fund (R-6)
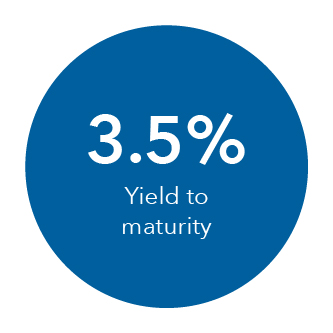
As of 12/31/2023. Yield to maturity.
-
Inflation protection
Bonds directly linked to the Consumer Price Index can help to protect an investor’s purchasing power.
Fund vs. inflation
The Bond Fund of America (R-6)
Fund lifetime average annualized returns (5/28/74-12/31/2023)
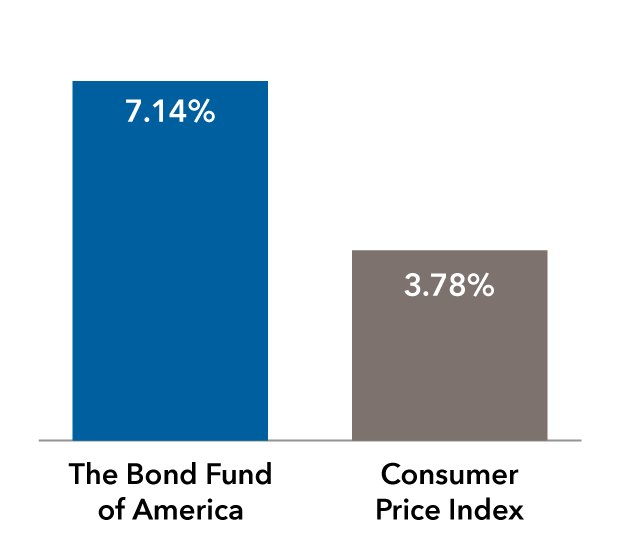
CPI return is based on average annualized monthly change for the Consumer Price Index for All Urban Consumers.
American Funds Strategic Bond Fund (R-6)
Fund lifetime average annualized returns (3/18/16-12/31/2023)
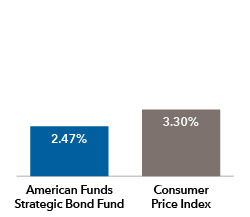
CPI return is based on average annualized monthly change for the Consumer Price Index for All Urban Consumers.
-
Fixed income at Capital Group
For more than 40 years, Capital Group has been committed to investing in fixed income assets with the belief that high-conviction investing and diverse perspectives can produce better results.
TRUE CORE
• Mindful of correlations to equities
• Seek multiple sources of active return
DEEP RESEARCH
• 238 fixed income investment professionals*
• Experienced teams cover every sector
RISK AWARENESS
• Dedicated, experienced risk team
• Integrated across all stages of the investment process
STRONG RESULTS
• Focus on risk-adjusted, long-term results
• Seek resilience during stock market volatility
ALIGNED WITH PARTICIPANTS
• 100% manager ownership in each fixed income mutual fund (excluding state-specific municipal funds)†
• Strive to keep fees low
STRENGTH IN NUMBERS
• $498 billion in fixed income assets; $2.5 trillion in total assets under management‡
• Has managed fixed income assets since 1974
INSIGHTS & RESOURCES
Find the right investments
🔒TOOLS
Create and monitor fund lineups with this tool showing available investment options’ returns, expenses and more.
Want to learn more about the four roles of fixed income in retirement planning?
Learn more about fixed income within our target date retirement series
*As of December 31, 2023.
†According to the most recent Statements of Additional Information, as of March 1, 2024.
‡Capital Group manages equity assets through three investment groups. These groups make investment and proxy voting decisions independently. Fixed income investment professionals provide fixed income research and investment management across the Capital organization; however, for securities with equity characteristics, they act solely on behalf of one of the three equity investment groups. Assets managed by Capital Fixed Income Investors as of December 31, 2023. All values in USD.
§The extent to which a fund contributes to a specified role depends on the portfolio’s composition at any point in time.
Unless otherwise indicated, data is as of December 31, 2023, and fund data is for Class R-6 shares.
The Morningstar intermediate core bond category includes funds that invest primarily in investment-grade (BBB/Baa and above) U.S. fixed income issues and typically hold less than 5% in below-investment-grade (BB/Ba and below) exposures. Their durations typically range between 75% and 125% of the three-year average of the effective duration of the Morningstar Core Bond Index, which is Morningstar's proxy for the overall bond market.
Intermediate-term core-plus bond portfolios invest primarily in investment-grade U.S. fixed income issues including government, corporate, and securitized debt, but generally have greater flexibility than core offerings to hold non-core sectors such as corporate high yield, bank loan, emerging-markets debt, and non-U.S. currency exposures. Their durations (a measure of interest-rate sensitivity) typically range between 75% and 125% of the three-year average of the effective duration of the Morningstar Core Bond Index, which is Morningstar's proxy for the overall bond market.
Average life includes the impact of callable bonds; effective duration is a duration calculation for bonds that takes into account that expected cash flows will fluctuate as interest rates change; yield to maturity is the rate of return anticipated on a bond if it is held until the maturity date; yield to worst is the lowest yield that can be realized by either calling or putting on one of the available call/put dates, or holding a bond to maturity; option-adjusted spread is a yield-spread calculation used to value securities with embedded options.
Consumer Price Index (CPI) is a measure of the average change over time in the prices paid by urban consumers for a market basket of consumer goods and services. Widely used as a measure of inflation, the CPI is computed by the U.S. Department of Labor, Bureau of Labor Statistics.
S&P 500 Index is a market capitalization-weighted index based on the results of approximately 500 widely held common stocks. This index is unmanaged, and its results include reinvested dividends and/or distributions but do not reflect the effect of sales charges, commissions, account fees, expenses or U.S. federal income taxes.
- Class R-6 shares were first offered on 5/1/2009.