April 1, 2025
KEY TAKEAWAYS
- For retirees seeking growth opportunities while navigating market uncertainty, insurance solutions like registered index-linked annuities (RILAs) are gaining popularity for their offer of a more measured approach to risk.
- RILAs have traditionally linked their returns to indexes. Some newer products link to actively managed investments, which can allow for diversification beyond indexes and could lead to higher potential returns within the RILA structure.
- Allowing large amounts of cash to sit on the sidelines can be costly for investors, especially for those who need growth-oriented strategies to meet their objectives in retirement.
Most retirees face the ongoing challenge of balancing the need for growth with the desire to manage risk. Traditional fixed income options may not provide enough return, while full equity exposure may introduce more volatility than these investors can tolerate. To bridge this gap, structured solutions have emerged to offer a middle ground. One such option is the registered index-linked annuity, or RILA, which provides a range of growth potential and downside protection options. By allowing continued equity participation while helping to mitigate volatility, RILAs can help align clients’ financial goals with their tolerance for risk – especially where the alternative might be to leave savings in cash.
Traditionally, RILAs are linked to the price return of a passive market index such as the S&P 500 Index, Russell 2000 Index or MSCI EAFE (Europe, Australasia, Far East) Index. However, while the returns a purchaser receives are related to the returns of the indexed investment, they are not the same. Investor returns are instead offered through some combination of two common RILA crediting and protection strategies: a capped upside with a buffer of downside protection, or a participation rate with a floor on losses.
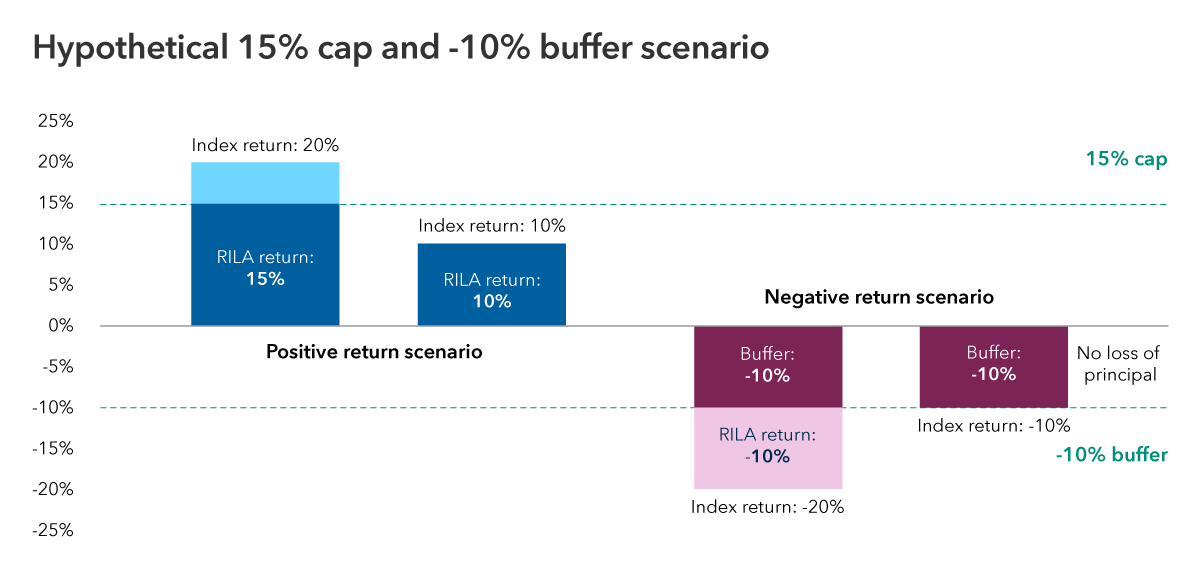
The following hypothetical shows cap and buffer scenarios where the investor’s gains would be capped to a maximum 15% on the upside, even if the index returned more, while a buffer would limit losses to 10% on the downside.
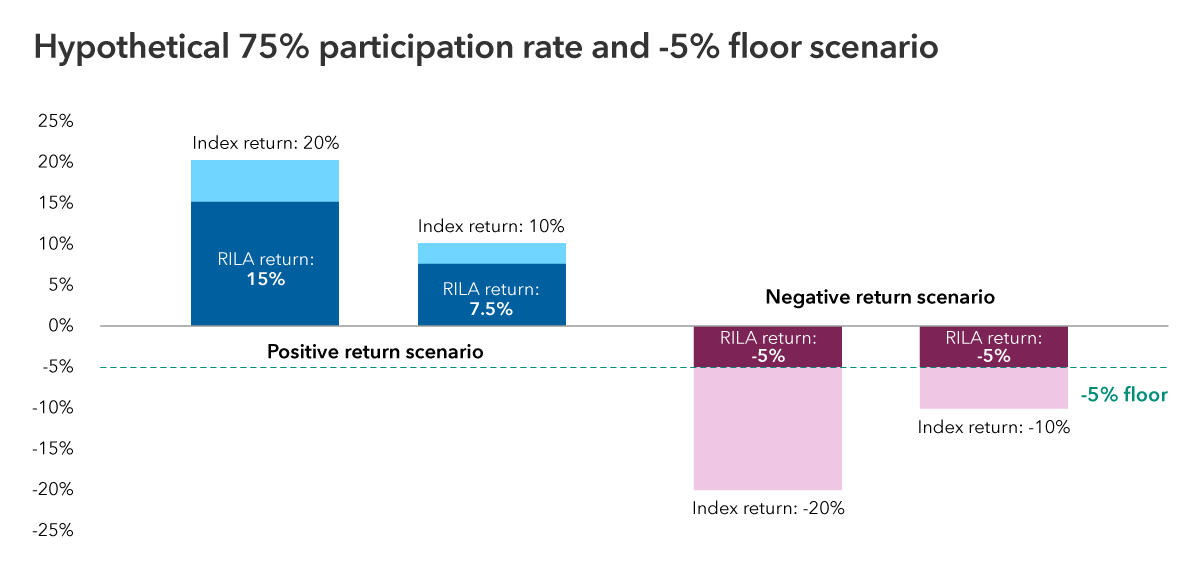
This second example shows a participation rate and floor strategy, where the investor would earn 75% of the index return on the upside but, in the event of a negative return, their losses would be limited to a max of -5%.
Buffer and floor strategies like these can help mitigate volatility and limit potential losses, but they do not provide complete protection. In poor market conditions, a policyholder’s account balance may still decline depending on the level of protection chosen. Additionally, crediting and protection rates can vary based on the selected strategy and may change over time.
Active strategies paired with RILAs
Until recently, strategies linked to indexes were the only kind available in RILAs, making those investments passive and leaving purchasers with little option for diversification beyond an index. However, Capital Group has been partnering with insurers who are delivering a new kind of RILA strategy — one that instead is linked to the returns of one of our actively managed mutual funds or ETFs.
The advantage of an active strategy is most apparent within the potential cap range, as it offers potential to outperform a passive index and maximize investor gains. While returns above the cap provide no additional benefit, an active approach could capture excess returns up to that point. This makes the active strategies potentially valuable in market conditions where disciplined selection and strategic positioning could help drive stronger results than a passive index alone.
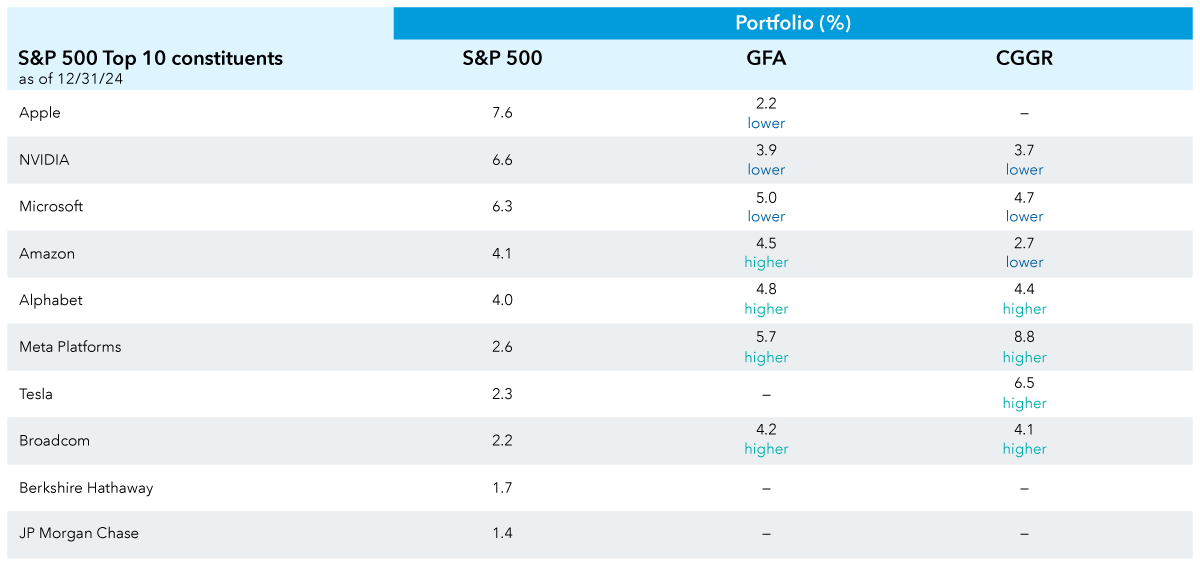
Think of the outsized dominance and growth of tech firms in the last decade, especially the so-called “magnificent seven” – the group of companies (Alphabet, Amazon, Apple, Meta Platforms, Microsoft, NVIDIA and Tesla) that were seeing outsized returns in U.S. markets in 2023 when the term originated. Indexes like the S&P 500, which weight constituents by market capitalization, have become more concentrated in companies like these. For example, the top 10 constituents in the S&P 500, which includes the magnificent seven, accounted for more than 38% of its total market capitalization as of December 31, 2024. This far exceeds the last major peak of concentration, in 2000 during the dotcom bubble, when the top 10 constituents accounted for 26% of total capitalization.1 This means that swings in value of just a few companies can affect returns.
However, our fund managers can take a differentiated strategy. Compare our fund holdings in this chart with the S&P 500’s top 10 constituents. The Growth Fund of America (GFA) and Capital Group Growth ETF (CGGR) have similar large capitalization focuses as the S&P 500, which is the benchmark index for both funds, yet both differ considerably from it in weightings. Such diversification can help investors mitigate risk while continuing to pursue growth. Diversification does not ensure a profit or guarantee against a loss.
The cost of staying on the sidelines
Many investors today err on the side of caution, keeping record amounts of cash on the sidelines in the process — more than $7 trillion, according to data from the federal government’s Office of Financial Research.2 Holding large amounts of cash may well feel like a safer choice than the market, especially in times of unpredictable volatility, but doing so can lead to missed growth opportunities, potentially affecting retirement income and portfolio values in the long term.
While past performance is not predictive of future results, historical trends can provide perspective on potential missed opportunities: Since 1937, the S&P 500 has delivered positive annual returns in 66 of the 87 years, with a median return of approximately 15%. Nearly a quarter of those years saw returns within 5% of the median.3 While those 21 calendar year losses represent less than a quarter of the total period, they may have led many investors to hold on to cash in fear of portfolio declines.
Even with today’s relatively higher savings yields, sitting on cash or attempting to time the market can be costly especially for retirees who need growth strategies to support income and/or legacy goals in uncertain markets. RILAs may offer such investors opportunities to reorient their investments for growth while maintaining a level of potential downside risk they’re comfortable with.
Who could benefit from an active investment strategy within a RILA?
- Near-retirees and retirees: Those seeking growth-oriented strategies but who are hesitant about the potential for market losses. While potential downside protection is typical in a RILA, linking it to an active strategy could offer greater growth potential than an index-linked strategy.
- Cautious investors: Those holding higher-than-normal amounts of cash who are reluctant to invest due to market uncertainties may find RILAs to be a more balanced option, helping them move off the sidelines and explore growth opportunities.
- Diversification seekers: Investors looking to complement their existing investments may be interested in incorporating active strategies to add tailored growth potential to their portfolios.
Financial professionals play a key role in helping clients navigate market cycles with confidence. Combined with the potential downside protection of RILA products, active strategy-linked investing can help keep clients focused on long-term goals. Now could be the time to evaluate solutions that best align with each investor’s unique needs.

Kate Beattie is a senior retirement income strategist with 18 years of investment industry experience (as of December 31, 2024). She holds a bachelor’s degree in economics with a business administration minor from Colorado State University and holds the Certified Financial Planner™ and Retirement Income Certified Professional® designations.


